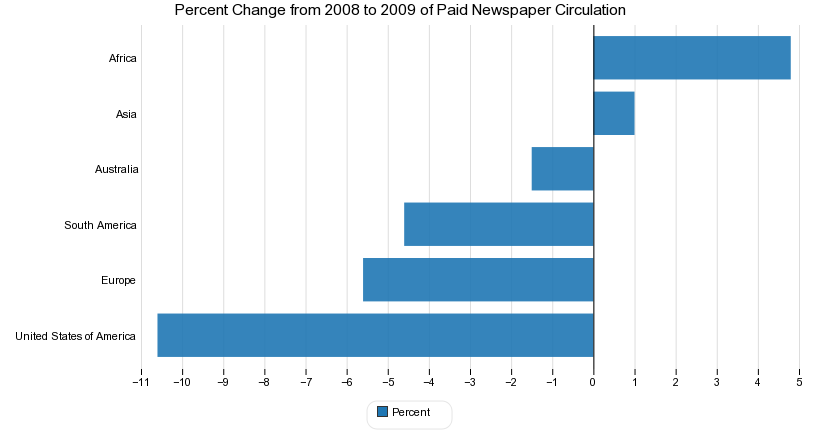
Percent Change from 2008 to 2009 of Paid Newspaper Circulation
Do you like this chart?
✔ Yes
✖
✚ Share
References and Data Table
HTML Embed code
$ Buy Now
2,184 views
- Add new comment

Computer and Internet Use Percent 2001
0.00 rating | 2,627 views | 0 comments
Paid Newspaper Circulation Percent 2008 2009
5.00 rating | 2,465 views | 0 comments
World Literacy Map: Literacy Rate Adult Total of Pe ...
4.08 rating | 35,993 views | 0 comments
Literacy Rate in Adult Female 15
1.00 rating | 1,868 views | 0 comments