Get free updates by Email

Report an error

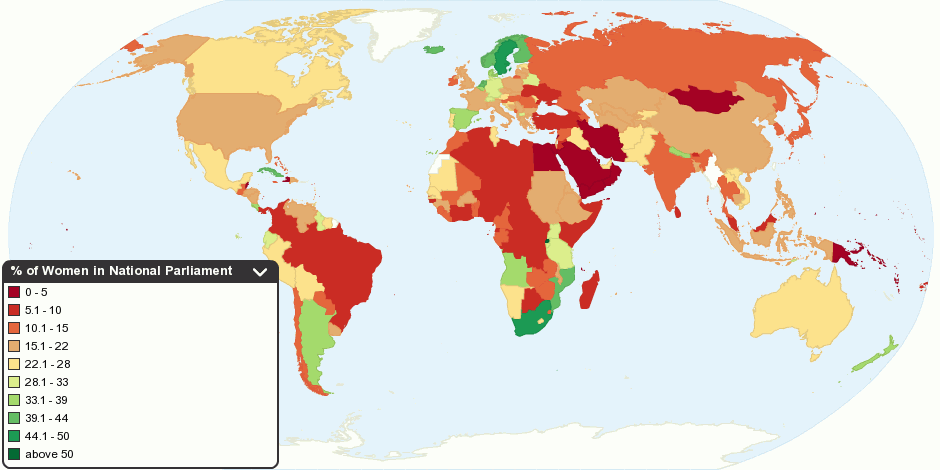
Proportion of Seats Held by Women in National Parliaments

Proportion of Seats Held by Women in National Parliaments
Country name% WomenTotal seatsNo. WomenElection yearNote
Rwanda56.3%80459/2008
Sweden46.4%3491629/2006
South Africa44.5%4001784/2009The figures on the distribution of seats do not include the 36 special rotating delegates appointed on an ad hoc basis, and all percentages given are therefore calculated on the basis of the 54 permanent seats.
Cuba43.2%6142651/2008
Iceland42.9%63274/2009
Netherlands42%1506311/2006
Finland40%200803/2007
Norway39.6%169679/2009
Mozambique39.2%2509810/2009
Angola38.6%220859/2008
Costa Rica38.6%57222/2010
Argentina38.5%257996/2009
Belgium38%150576/2007
Denmark38%1796811/2007
Spain36.6%3501283/2008
Andorra35.7%28104/2009
New Zealand33.6%1224111/2008
Nepal33.2%5941974/2008
Germany32.8%6222049/2009
Macedonia [FYROM]32.5%120396/2008
Ecuador32.3%124404/2009
Belarus31.8%110359/2008
Uganda31.5%3241022/2006
Burundi31.4%118377/2005
Tanzania30.7%3239912/2005
Guyana30%70218/2006
Timor-Leste29.2%65196/2007
Switzerland29%2005810/2007
Austria27.9%183519/2008
Tunisia27.6%2145910/2009
Peru27.5%120334/2006
Portugal27.4%230639/2009
Australia27.3%1504111/2007
Afghanistan27.3%249689/2005
Namibia26.9%671811/2009
Trinidad and Tobago26.8%411111/2007
Mexico26.2%5001317/2009
Monaco26.1%2362/2008
Vietnam25.8%4931275/2007
Kyrgyzstan25.6%902312/2007
Suriname25.5%51135/2005
Bolivia25.4%1303312/2009
Iraq25.2%325823/2010
Laos25.2%115294/2006
Lesotho24.2%120292/2007
Liechtenstein24%2562/2009
Moldova23.8%101247/2009
Croatia23.5%1533611/2007
Seychelles23.5%3485/2007
Singapore23.4%94225/2006
Estonia22.8%101233/2007
Senegal22.7%150346/2007
United Arab Emirates22.5%40912/2006
Pakistan22.2%342762/2008
Mauritania22.1%952111/2006
Canada22.1%3086810/2008
Eritrea22%150332/1994
Latvia22%1002210/2006
Uzbekistan22%1503312/2009
Ethiopia21.9%5291165/2005
Saint Vincent and the Grenadines21.7%23512/2005
Serbia21.6%250545/2008
China21.3%29876373/2008
Italy21.3%6301344/2008
Cambodia21.1%123267/2008
Philippines21%267565/2007
Bulgaria20.8%240507/2009
Malawi20.8%192405/2009
Nicaragua20.7%921911/2006
Dominica20%25512/2009
Luxembourg20%60126/2009
Poland20%4609210/2007
Dominican Republic19.7%178355/2006
United Kingdom19.5%6461265/2005
Guinea19.3%114226/2002The parliament was dissolved following the December 2008 coup
Israel19.2%120232/2009
Lithuania19.2%1412710/2008
Bosnia and Herzegovina19.1%42810/2006
El Salvador19.1%84161/2009
Sudan18.9%444848/2005
France18.9%5771096/2007
Bangladesh18.6%3456412/2008
Cape Verde18.1%72131/2006
Indonesia18%5601014/2009
Slovakia18%150276/2006
Honduras18%1282311/2009
Kazakhstan17.8%107198/2007
Venezuela17.5%1662912/2005
Tajikistan17.5%63112/20052/2010 Elections result waiting
Greece17.3%3005210/2009
Mauritius17.1%70127/2005
Turkmenistan16.8%1252112/2008
United States16.8%4357311/2008The total refers to all voting members of the House.
San Marino16.7%601011/2008
Albania16.4%140236/2009
Korea, North15.6%6871073/2009
Czech Republic15.5%200316/2006
Burkina Faso15.3%111175/2007
Uruguay15.2%991510/2009
Zimbabwe15%214323/2008
Korea, South14.7%299444/2008
Gabon14.7%116171/2009
Slovenia14.4%90139/2008
Chile14.2%1201712/2009
Zambia14%157229/2006
Russia14%4506312/2007
Ireland13.9%165235/2007
Cameroon13.9%180257/2007
Djibouti13.9%6592/2008
Swaziland13.6%6699/2008
Grenada13.3%1527/2008
Jamaica13.3%6089/2007
Thailand13.3%4736312/2007
Sierra Leone13.2%121168/2007
Cyprus12.5%5675/2006
Liberia12.5%64810/2005
Paraguay12.5%80104/2008
Syria12.4%250314/2007
Bahamas, The12.2%4155/2007
Guatemala12%158199/2007
Azerbaijan11.4%1231411/2005
Romania11.4%3343811/2008
Japan11.3%480548/2009
Hungary11.1%386434/2006
Montenegro11.1%8193/2009
Saint Lucia11.1%18212/2006
Togo11.1%81910/2007
Benin10.8%8393/2003
India10.8%545594/2009
Antigua and Barbuda10.5%1923/2009
Morocco10.5%325349/2007
Mali10.2%147157/2007
Barbados10%3031/2008
Equatorial Guinea10%100105/2008
Guinea-Bissau10%1001011/2008
Malaysia9.9%222223/2008
Kenya9.8%2242212/2007
Niger9.7%1131110/2009
Central African Republic9.6%104103/2005
Armenia9.2%131125/2007
Turkey9.1%549507/2007
Côte d'Ivoire8.9%2031812/2000
Brazil8.8%5134510/2006
Malta8.7%6963/2008
Bhutan8.5%4743/2008
Panama8.5%7165/2009
Fiji8.5%71608/2001
Colombia8.4%166143/20063/2010 Elections result waiting
Congo, Democratic Republic of the8.4%500427/2006
Ghana8.3%2301912/2008
Samoa8.2%4943/2006
Ukraine8%450369/2007
Botswana7.9%63510/2009
Madagascar7.9%127109/2007
Algeria7.7%389305/2007
Kuwait7.7%6555/2009
Libya7.7%468363/2009
Gambia, The7.6%5341/2002
Congo, Republic of the7.3%137106/2007
Sao Tome and Principe7.3%5543/2006
Nigeria7%358254/2007
Somalia6.9%539378/2004
Saint Kitts and Nevis6.7%1511/2010
Georgia6.5%13895/2008
Maldives6.5%7755/2009
Jordan6.4%110711/2007
Sri Lanka5.8%225134/2004
Chad5.2%15584/2002
Kiribati4.4%4628/2007
Haiti4.1%9842/2006
Mongolia4%7636/2008
Vanuatu3.9%5229/2008
Lebanon3.1%12846/2009
Tonga3.1%3214/2008No women were elected in 2008, however one woman was appointed to the Cabinet. As cabinet ministers also sit in parliament, there is one woman out of a total of 32 members.
Comoros3%33112/2009
Marshall Islands3%33111/2007
Iran2.8%29083/2008
Bahrain2.5%40111/2006
Egypt1.8%454811/2005
Papua New Guinea0.9%10916/2007
Yemen0.3%30114/2003
Belize0%3202/2008
Micronesia, Federated States of0%1403/2009
Nauru0%1804/2008
Oman0%84010/2007
Palau0%16011/2008
Qatar0%3507/2008
Saudi Arabia0%15002/2009
Solomon Islands0%5004/2006
Tuvalu0%1508/2006
No Results
Filter :Loading...

the State of Democracy in the World

3.62 rating | 27,649 views | 2 comments

Political Map of Asia

3.29 rating | 5,569 views | 0 comments

Arab Countries and Democracy Index

1.00 rating | 5,514 views | 2 comments

Map of European Union Member States

3.94 rating | 295,208 views | 2 comments
About | Chat | Contact | Sign Up | Privacy | Legal | Feedback