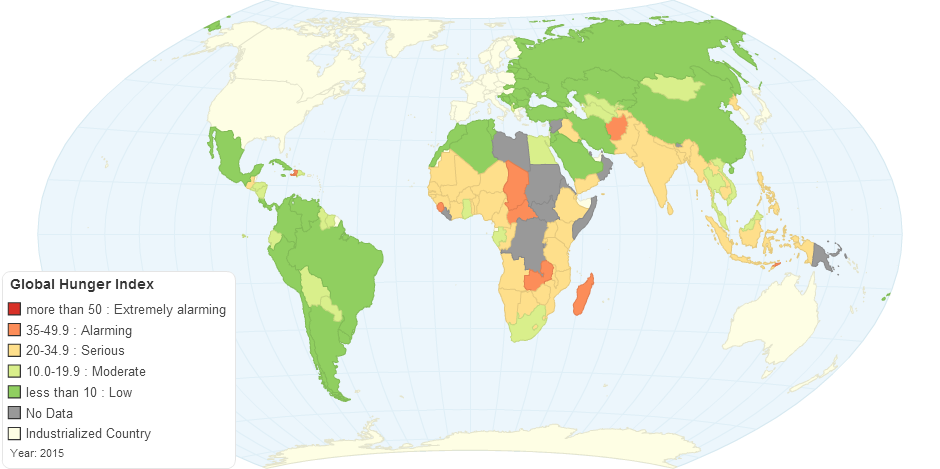
This map shows Global Hunger Index (GHI) for 128 developing countries.
The Global Hunger Index (GHI) is a tool adapted and further developed by the International Food Policy Research Institute (IFPRI) to comprehensively measure and track global hunger. The GHI incorporates three interlinked hunger-related indicators - the proportion of undernourished in the population, the prevalence of underweight in children, and the mortality rate of children.
The GHI aims to raise awareness of regional and country differences in hunger and trigger action to eliminate hunger. Targeted at a wide range of audiences - including policy-makers, donors, non-governmental organizations, educators, the media, and the broader public - the GHI provides insights into the drivers of hunger and highlights successes and failures in hunger reduction.
The 2015 GHI has improved by slightly more than one-quarter over the 1990 GHI, but globally, hunger remains at a level categorized as “serious.” In addition to presenting the 2015 GHI scores, the report examines the issue of price spikes and excessive food price volatility, which have significant effects on poor and hungry people.
How is the Global Hunger Index calculated?
The GHI is based on a multidimensional approach to measuring and tracking hunger. It combines three equally weighted indicators:
- The proportion of undernourished as a percentage of the population (reflecting the share of the population with insufficient dietary energy intake);
- The prevalence of underweight in children under the age of five (indicating the proportion of children suffering from low weight for their age); and
- The mortality rate of children under the age of five (partially reflecting the fatal synergy between inadequate dietary intake and unhealthy environments).
The multidimensional approach of the GHI offers several advantages. It captures various aspects of hunger in one index number, thereby presenting a quick overview of a complex issue. It takes account of the nutrition situation not only of the population as a whole, but also of a physiologically vulnerable group - children - for whom a lack of nutrients causes a high risk of illness, poor physical and cognitive growth, and death. In addition, by combining independently measured indicators, it reduces the effects of random measurement errors.
The index ranks countries on a 100-point scale, with 0 being the best score (no hunger) and 100 being the worst. Values less than 10.0 reflect low hunger, values between 10.0 and 19.9 reflect moderate hunger, values between 20.0 and 34.9 indicate a serious problem, values between 35.0 and 49.9 are alarming, and values of 50.0 or higher are extremely alarming.
10 years ago

