-
Health
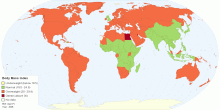
Body Mass Index (BMI) by Country
This map shows World trends in age-standardized mean Body Mass Index (BMI) 199 countries over 28 years. The worldwide prevalence of obesity has nearly doubled s ...4.12 rating | 199,860 views | 11 Comments15 years ago -
Drugs & Crime
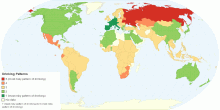
Worldwide Alcohol Drinking Patterns
This map shows worldwide alcohol drinking patterns. Alcohol drinking patterns is based on Patterns of Drinking Score. What is the Patterns of Drinking Score (PD ...4.33 rating | 34,019 views | 1 Comment15 years ago -
Environment
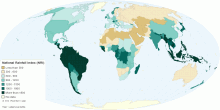
National Rainfall Index (NRI)
This map shows national rainfall index (NRI). Waht is National Rainfall Index (NRI)? A national rainfall index (NRI) is defined as the national average of the ...4.62 rating | 38,331 views | Discuss this15 years ago -
Country Info
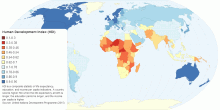
Human Development Index (HDI)
HDI is a composite statistic of life expectancy, education, and income per capita indicators. A country scores higher HDI when the life expectancy at birth is lo ...4.00 rating | 5,137 views | Discuss this10 years ago -
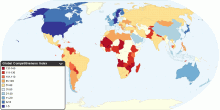
Economic
Global Competitiveness Index
This map shows 2010-2011 Global Competitiveness Index (GCI) in 139 major and emerging economies from all of the world's regions. The GCI, a highly comprehensive ...4.49 rating | 38,958 views | 3 Comments16 years ago -
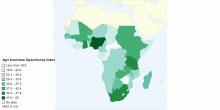
Food & Agriculture
Agri Business Opportunities in Sub Sahara Africa
Index based on 20 selected indicators5.00 rating | 2,202 views | Discuss this15 years ago -
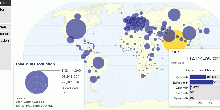
Food & Agriculture
Global Nutrition Consumption and BMI
This map shows worldwide nutrition consumption and body mass index data. The dietary energy consumption per person is the amount of food, in kcal per day, for ea ...3.95 rating | 105,179 views | 7 Comments15 years ago -
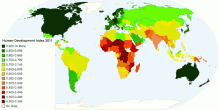
Country Info
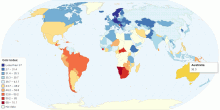
Human Development Index 2011
This map shows the human development in 2001 with 187 countries5.00 rating | 4,990 views | Discuss this11 years ago -
Country Info
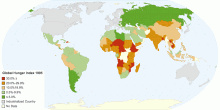
Global Hunger Index 1995
This map shows the hunger in 1995 with 155 countries2.33 rating | 4,849 views | Discuss this11 years ago -
Country Info
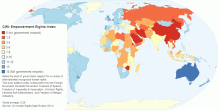
CIRI: Empowerment Rights Index
Rates the level of government respect for a variety of internationally recognized human rights. This is an additive index constructed from the Foreign Movement, ...3.18 rating | 5,533 views | Discuss this10 years ago -
Economic
Distribution of Family Income - Gini Index
This map shows the degree of inequality in the distribution of family income (Gini index or Gini coefficient) in each country. Income distribution measure ...4.47 rating | 80,361 views | 6 Comments15 years ago -
Country Info
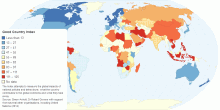
Good Country Index
The Index attempts to measure the global impacts of national policies and behaviours: what the country contributes to the global commons and what they take away. ...2.86 rating | 10,657 views | Discuss this10 years ago -
Country Info
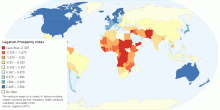
Legatum Prosperity Index
The ranking is based on a variety of factors including wealth, economic growth, education, health, personal well-being, and quality of life. Source: Legatum (2015)0.00 rating | 4,133 views | Discuss this10 years ago -
Country Info
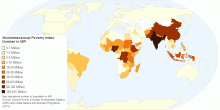
Multidimensional Poverty Index: Number in MPI
Map represents number of population in MPI. Source: Oxford Poverty & Human Development Initiative (OPHI) and United Nations Development Programme (2015)3.35 rating | 5,791 views | Discuss this10 years ago -
Country Info
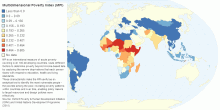
Multidimensional Poverty Index (MPI)
MPI is an international measure of acute poverty covering over 100 developing countries. Uses different factors to determine poverty beyond income-based lists by ...3.91 rating | 5,095 views | Discuss this10 years ago