-
Country Info
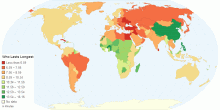
Who Lasts the Longest?
This Map shows how long on average Porhub users around the world spend on the site by country. The data used was compiled over the Fall of 2014.4.27 rating | 24,586 views | Discuss this11 years ago -
Others
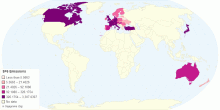
Sulphur Hexafluoride SF6 Emissions by country
This chart shows the Sulphur hexafluoride (SF6) Emissions by country. Sulfur hexafluoride (SF6) is an inorganic, colorless, odorless, non-flammable, extremely p ...5.00 rating | 4,541 views | Discuss this10 years ago -
Health
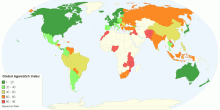
Global Agewatch Index
This chart shows the Global AgeWatch Index 2015. The Global AgeWatch Index provides an analysis of results by region. It measures four key domains for older peo ...4.05 rating | 12,502 views | Discuss this10 years ago -
Education
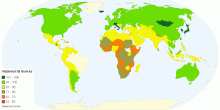
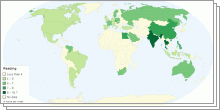
National IQ Scores
This chart shows the IQ Scores by Country. An intelligence quotient (IQ) is a score derived from one of several standardized tests designed to assess human inte ...4.24 rating | 79,378 views | Discuss this10 years ago -
People
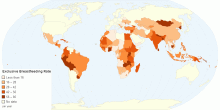
Exclusive Breastfeeding Rate by Country
This chart shows exclusive breastfeeding rate by country. Breastfeeding or nursing is feeding of babies and young children with milk from a female breast.Breast ...3.53 rating | 8,162 views | Discuss this11 years ago -
Economic
Economic Gross Value Added Activity by Country
This charts shows economic gross value added activity by country. Gross value added (GVA) is a measure in economics of the value of goods and services produced ...3.00 rating | 10,326 views | 2 Comments11 years ago -
Others
Inflation GDP Deflator by country.
This chart shows inflation GDP deflator by country. Inflation as measured by the annual growth rate of the GDP implicit deflator shows the rate of price change ...4.00 rating | 8,675 views | Discuss this11 years ago -
Others
Reserves SDR Holdings by Country
This chart shows reserves SDR holdings by country. The SDR is an international reserve asset created by the IMF in 1969 to supplement to existing reserve assets ...2.71 rating | 11,100 views | Discuss this11 years ago -
Country Info
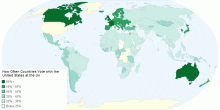
How Often Countries Vote with the United States at the UN
This map shows voting coincidence with the united states. The United States is a federal constitutional republic, in which the President of the United States (t ...4.43 rating | 12,054 views | Discuss this11 years ago -
Others
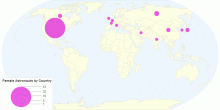
Female Astronauts by Country
This map shows details for female astronauts by country.5.00 rating | 5,303 views | 1 Comment11 years ago -
Country Info
Culture Score Index
This group of map shows Culture Score(TM) "Media Habits" Index, it gives a global perspective on the time consumers report watching television, listeni ...4.29 rating | 10,292 views | Discuss this11 years ago -
Food & Agriculture
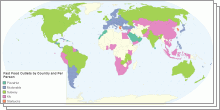
Fast-food nations
This Chart Shows Fast Food details for McDonalds, KFC, Starbucks, Pizza Hut and Subway.4.33 rating | 11,850 views | Discuss this11 years ago -
Others
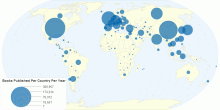
Books Published Per Country Per Year
This chart shows Number of Books Published per country per year.The United Nations Educational, Scientific and Cultural Organization (UNESCO) monitors both the n ...4.24 rating | 14,030 views | Discuss this11 years ago -
Environment
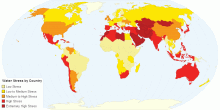
Water Stress by Country
This Map shows the average exposure of water users in each country to water stress. Most water-related decisions are made across political or administra ...4.20 rating | 16,295 views | Discuss this11 years ago -
Sports
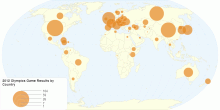
2012 Olympics Game Results
This map shows list of country ranked by the medals won during 2012 Summer Olympics in London ,the Capital of United Kingdom , from 27 July to 12 August 201 ...4.00 rating | 10,835 views | Discuss this11 years ago