-
People
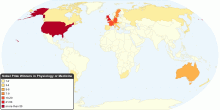
Nobel Prize Winners in Physiology or Medicine by Country
This chart shows current Nobel Prize Winners in Physiology or Medicine ranked by country. The Nobel Prize Winners in Physiology or Medicine has been awarded 196 ...4.38 rating | 22,343 views | Discuss this15 years ago -
Health
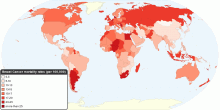
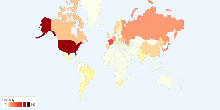
Current Worldwide Breast Cancer Mortality Rate
This map shows current worldwide Breast Cancer Age-standardised mortality rates. Breast cancer is by far the most frequent cancer among women with an estimated 1 ...4.57 rating | 38,754 views | 1 Comment15 years ago -
Economic
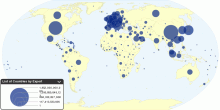
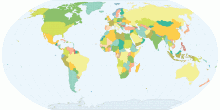
List of Countries by Exports
This map shows list of countries by exports. Exports means goods manufactured domestically that are bought by foreigners and sent to another county. The value re ...3.52 rating | 21,285 views | 2 Comments15 years ago -
Drugs & Crime
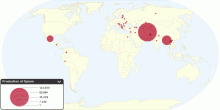
Current Worldwide Illicit Cultivation of Opium Popp ...
This chart shows current worldwide illicit cultivation of opium poppy and production of opium. Total area under opium poppy cultivation in the major culti ...4.19 rating | 183,508 views | Discuss this15 years ago -
Country Info
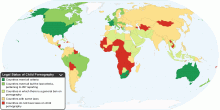
Legal Status of Child Pornography by Country
This map shows legal status of child pornography. Child pornography refers to images or films (also known as child abuse images) and in some cases writings depic ...4.04 rating | 1,060,385 views | 78 Comments15 years ago -
Social
Worldwide Distribution of Suicides Rates by Gender ...
This chart shows worldwide distribution of suicides rates by gender and age for year 2000. Suicide is among the three leading causes of death among those aged 15 ...4.08 rating | 47,717 views | 3 Comments16 years ago -
Energy
Current Nuclear Electricity Generation by Country
This chart shows current Nuclear Electricity Generation worldwide. Current Nuclear Electricity Generation: 2601 billion kWh from 436 nuclear power reactors Not ...4.60 rating | 16,278 views | 1 Comment16 years ago -
Energy
Current Worldwide Reserves-to-production ratio of N ...
This chart shows the Current Worldwide Reserves-to-production ratio of Natural Gas. Current World Reserves-to-production ratio of Natural Gas: 60.35 Years What ...4.13 rating | 14,404 views | 1 Comment16 years ago -
Energy
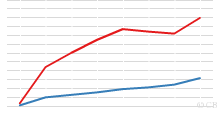
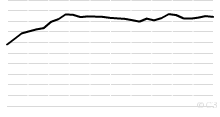
Historical World Reserves-to-production ratio of Oi ...
This chart shows the Historical World Reserves-to-production ratio of Oil - 1980 onwards. Current World Reserves-to-production ratio of Oil: 42.11 Years What D ...4.17 rating | 22,680 views | Discuss this16 years ago -
Energy
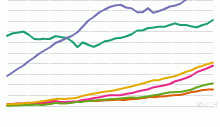
Historical Natural Gas Consumption by Region, 1965 ...
This chart shows the historical Natural Gas Consumption - 1965 onwards. List of countries included in each region: North America includes United States,Cana ...4.37 rating | 12,632 views | Discuss this16 years ago -
Energy
Historical Natural Gas Production by Region, 1970 t ...
This chart shows the historical Natural Gas Production - 1970 onwards. List of countries included in each region: North America includes United States,Canad ...4.11 rating | 12,124 views | Discuss this16 years ago -
Country Info
Current Head of Government by Country
This map shows Current Head of Government in every country. What is Head of Government? Head of government is the chief officer of the executive branch of a go ...3.85 rating | 69,436 views | 16 Comments10 years ago -
Health
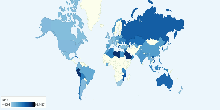
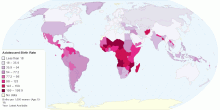
Adolescent Birth Rate
This map shows adolescent birth rate, that measures the annual number of births to women 15 to 19 years of age per 1,000 women in that age group. It represents t ...4.54 rating | 34,077 views | 3 Comments14 years ago -
People
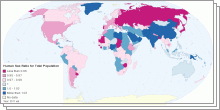
World Sex Ratio 2011
This collection of interactive maps shows Sex Ratio in five age groups - at birth, under 15 years, 15-64 years, 65 years and over, and for the total population. ...4.01 rating | 216,465 views | 3 Comments14 years ago -
Environment
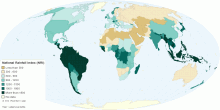
National Rainfall Index (NRI)
This map shows national rainfall index (NRI). Waht is National Rainfall Index (NRI)? A national rainfall index (NRI) is defined as the national average of the ...4.62 rating | 37,100 views | Discuss this14 years ago