-
Food & Agriculture
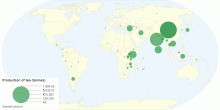
The World Production of Tea 2012
The biggest producer of tea for year 2012 was China.1.00 rating | 2,135 views | Discuss this10 years ago -
Country Info
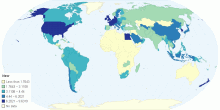
world agricultural productivity per hectar harvested
world agricultural productivity per hectar harvested5.00 rating | 8,654 views | Discuss this15 years ago -
Food & Agriculture
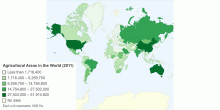
Agricultural Areas in the World
Croplands by country (organic and non organic).0.00 rating | 2,340 views | Discuss this13 years ago -
Population
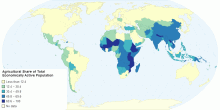
Economically Active Population in Agriculture Worldwide
Worlwide view of the share of the economically active population in Agriculture0.00 rating | 2,188 views | Discuss this12 years ago -
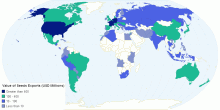
Food & Agriculture
Value of Seeds Exports Usd Millions
Value of seeds exports by country http://www.technavio.com/report/europe-seeds-market http://www.worldseed.org/isf/seed_statistics.html5.00 rating | 3,724 views | Discuss this11 years ago -
Country Info
Global Distribution of Secretariats Lead Partners A ...
Global Distribution of Secretariats Lead Partners Agriculture Commitments0.00 rating | 1,021 views | Discuss this11 years ago -
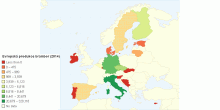
Food & Agriculture
European production of potatoes (2014)
Amount of produced potatoes in 20140.00 rating | 2,109 views | Discuss this10 years ago -
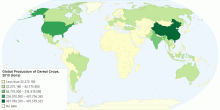
Food & Agriculture
Global Production of Cereal Crops, 2010 (tons)
Crops included (source: FAOSTAT) and total World values: Crop World production (tons) Barley 123695392 Buckwheat 151766 ...4.00 rating | 4,113 views | Discuss this14 years ago -
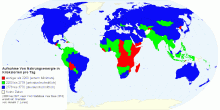
Food & Agriculture
Aufnahme Von Nahrungsenergie in Kilokalorien pro Ta ...
Aufnahme Von Nahrungsenergie in Kilokalorien pro Tag von 2005 bis 2007 (erstellt von Hendrik C. Lorenz nach Daten aus dem Statistical Yearbook 2010 der FAO)4.33 rating | 3,977 views | Discuss this14 years ago -
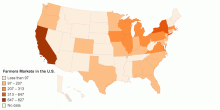
Country Info
Farmers Markets in the U.S.
Farmers Markets in the U.S. shown by state.0.00 rating | 1,570 views | Discuss this13 years ago -
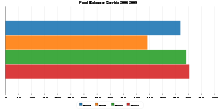
Food & Agriculture
Food Balance Serbia 2006 2009
Food balance sheet (crops&livestock equilent) for Serbia obtained as food supply minus food utilization1.00 rating | 1,236 views | Discuss this13 years ago -
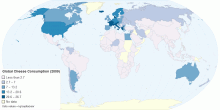
Food & Agriculture
Global Cheese Consumption 2009
Interactive map of 2009 cheese consumption levels from a global perspective. The map displays consumption values measured in kg/per person/year. Data was compil ...4.64 rating | 14,002 views | 1 Comment12 years ago -
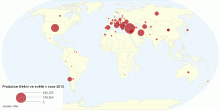
Food & Agriculture
Produkce třešní ve světě v roce 2013
Největšími producenty třešní jsou Turecko, USA, Írán.0.00 rating | 1,480 views | Discuss this10 years ago -
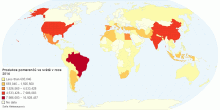
Food & Agriculture
Produkce pomerančů ve světě v roce 2014
Největším producentem pomerančů je Brazílie.0.00 rating | 1,544 views | Discuss this9 years ago -
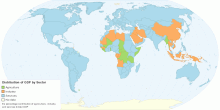
Economic
Current Worldwide Distribution of GDP by Economic Sector
This map shows worldwide distribution of gross domestic product (GDP) by economic sector. Current World Distribution of GDP by Sector: Agriculture: 5.8%; I ...4.41 rating | 111,278 views | Discuss this15 years ago