-
Country Info
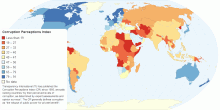
Corruption Perceptions Index
Transparency International (TI) has published the Corruption Perceptions Index (CPI) since 1995, annually ranking countries "by their perceiv ...5.00 rating | 3,648 views | Discuss this10 years ago -
Society
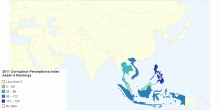
2011 Corruption Perceptions Index, Asean 6 Rankings
"The Corruption Perceptions Index ranks countries and territories according to their perceived levels of public sector corruption. It is an aggregate indica ...3.40 rating | 7,854 views | 1 Comment15 years ago -
Social
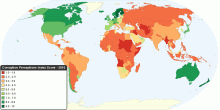
Corruption around the World
This chart shows Corruption Perceptions Index (CPI) around the world. The CPI index score on a scale from 10 (very clean) to 0 (highly corrupt). 2010 CPI key fi ...4.52 rating | 90,932 views | 8 Comments16 years ago -
Social
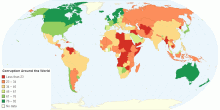
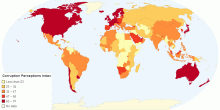
Corruption Around the World
This chart shows Corruption Perceptions Index (CPI) around the world. The CPI index score on a scale from 100 (very clean) to 0 (highly corrupt) What is the Cor ...4.03 rating | 14,869 views | Discuss this11 years ago -
Social
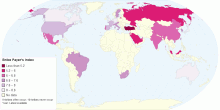
Bribe Payer's Index by Transparency International
The Bribe Payer's Index (BPI) measures the tendency of firms from top exporting countries to pay bribes or make undocumented payments while conducting busine ...4.50 rating | 27,635 views | 1 Comment15 years ago -
Country Info
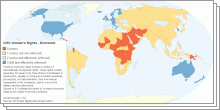
CIRI Human Rights Data Project 2011
Maps of different indicators and sub-indictors from the CIRI Human Rights Data Project: Overall Human Rights, Physical Integrity Rights Index, Empowerment Rights ...1.00 rating | 6,018 views | Discuss this10 years ago -
Economic
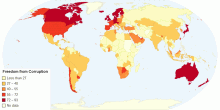
Freedom from Corruption
lack of corruption index5.00 rating | 3,036 views | Discuss this14 years ago -
Country Info
World Corruption
Transparency International (TI) corruption scores for selected countries. Lower values indicate higher corruption.5.00 rating | 3,787 views | Discuss this12 years ago -
Country Info
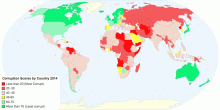
Corruption Scores by Country 2014
This is a score generated by Transparency International which measures corruption score by country, with higher values indicating less corruption.5.00 rating | 53,617 views | Discuss this11 years ago -
Country Info
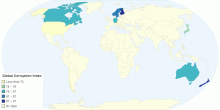
Global Corruption Index
GLOBAL CORRUPTION INDEX.5.00 rating | 2,853 views | Discuss this11 years ago -
Economic
Corruption Perceptions Index 2015
This chart shows the Corruptions Perception Index 2015. The 2015 Corruption Perceptions Index clearly shows that corruption remains a blight around the ...4.65 rating | 10,773 views | Discuss this10 years ago -
Society
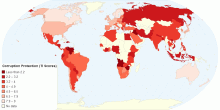
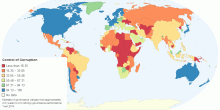
Control of Corruption
This map shows "Control of Corruption", a dimension of governances in Worldwide Governance Indicators (WGI) project by World Bank Group, which reflects ...4.38 rating | 20,173 views | 1 Comment10 years ago -
Drugs & Crime
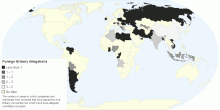
Foreign Bribery Allegations
Based on cases gathered by Transparency International, this map shows countries in which alleged corruption and foreign bribery has been committed by com ...0.00 rating | 4,579 views | Discuss this12 years ago -
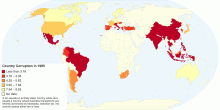
Country Info
Country Corruption in 1995
Level of corruption worldwide by country in 1995. Source: http://www.transparency.org/files/content/tool/1995_CPI_EN.pdf0.00 rating | 2,197 views | Discuss this10 years ago -
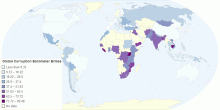
Country Info
Global Corruption Barometer Bribes
Global Corruption Barometer Bribes0.00 rating | 2,684 views | Discuss this11 years ago