-
Energy
Current Worldwide Natural Gas Production
This chart shows current Natural Gas Production in the world. Current Natural Gas Production in the World: 3,065,690,558,538 cubic meters (cu m)3.81 rating | 19,023 views | Discuss this16 years ago -
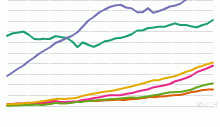
Energy
Historical Natural Gas Production by Region, 1970 t ...
This chart shows the historical Natural Gas Production - 1970 onwards. List of countries included in each region: North America includes United States,Canad ...4.11 rating | 11,931 views | Discuss this16 years ago -
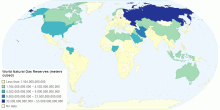
Energy
Current Worldwide Reserves-to-production ratio of N ...
This chart shows the Current Worldwide Reserves-to-production ratio of Natural Gas. Current World Reserves-to-production ratio of Natural Gas: 60.35 Years What ...4.13 rating | 14,249 views | 1 Comment16 years ago -
Energy
Historical World Reserves-to-production ratio of Na ...
This chart shows the Historical World Reserves-to-production ratio of Natural Gas - 1980 onwards. Current World Reserves-to-production ratio of Natural Gas: 60. ...5.00 rating | 9,797 views | Discuss this16 years ago -
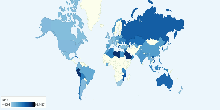
Country Info
World Natural Gas Reserves (meters cubed)
World natual gas reserves map3.67 rating | 11,380 views | Discuss this12 years ago -
Energy
Worldwide Proven Gas Reserves
Natural Gas reserves internationally 20110.00 rating | 1,692 views | Discuss this13 years ago -
Food & Agriculture
Světová produkce jablek 2018
Mapa zobrazující produkci jablek v roce 20180.00 rating | 1,334 views | Discuss this4 years ago -
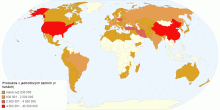
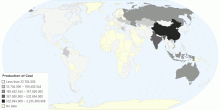
Economic
Production of Coal (2010)
Production of Coal (2010)0.00 rating | 1,963 views | Discuss this10 years ago -
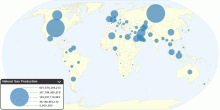
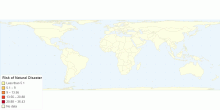
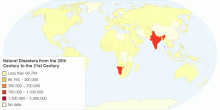
Country Info
Risk of Natural Disaster
/List_of_countries_by_natural_disaster_risk1.00 rating | 917 views | Discuss this9 years ago -
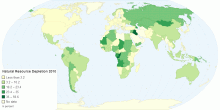
Environment
Natural Resource Depletion 2010
Natural Resource Depletion 2010 https://data.undp.org/dataset/Table-13-Environment/ki8j-r4i65.00 rating | 5,204 views | Discuss this11 years ago -
Environment
The impact of climate change on natural disasters o ...
Changes in climate do not just affect average temperatures, but also extreme temperatures, increasing the likelihood of weather-related natural disasters.3.00 rating | 3,337 views | Discuss this11 years ago -
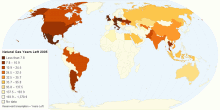
Country Info
Natural Gas Years Left 2005
Natural Gas, Years Left (2005) BP Statistical Review 2013 Reserve / consumption0.00 rating | 2,632 views | Discuss this11 years ago -
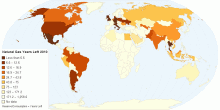
Country Info
Natural Gas Years Left 2010
Natural Gas years left 2010 BP Statsistical Review 2013 Reserves / consumption0.00 rating | 2,979 views | Discuss this11 years ago -
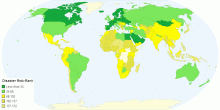
Health
Natural Disaster Risk 2015
This chart shows the Natural Disaster Risk 2015 by country. A natural disaster is a major adverse event resulting from natural processes of the Earth; examples ...4.33 rating | 10,560 views | Discuss this9 years ago -
Energy
Current Worldwide Natural Gas Consumption per capita
This chart shows current Natural Gas Consumption in the world. Current Natural Gas Consumption in the World: 444.1 cubic meters (m³) per capita4.13 rating | 12,498 views | Discuss this16 years ago