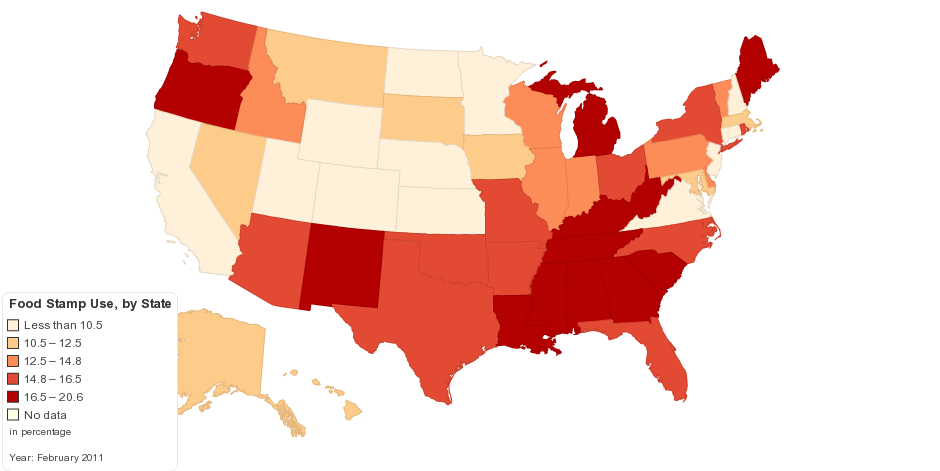
This map shows the percent of the population on food stamps in United States America.
More Americans are using food stamps, but the percent of the population enrolled in the program varies greatly by state.
15 years ago
| State | On food stamps February 2011 | 2010 population | % of population on food stamps | Monthly change in food stamps | Annual change in food stamps |
|---|---|---|---|---|---|
| Wyoming | 35,422 | 568,300 | 6.6 | 0.5 | 5.6 |
| New Jersey | 598,151 | 8,807,501 | 8.4 | 1.5 | 23.1 |
| New Hampshire | 102,783 | 1,321,445 | 8.5 | -0.3 | 9.8 |
| Colorado | 398,862 | 5,044,930 | 8.8 | 0.1 | 11.2 |
| North Dakota | 59,591 | 675,905 | 9.1 | -0.3 | 2.7 |
| Minnesota | 421,081 | 5,314,879 | 9.4 | 0.9 | 19 |
| Nebraska | 162,419 | 1,831,825 | 9.5 | 0.1 | 7.5 |
| California | 3,185,154 | 37,341,989 | 9.7 | 0.5 | 13.6 |
| Utah | 247,325 | 2,770,765 | 10.2 | -5.8 | 14.6 |
| Connecticut | 327,242 | 3,581,628 | 10.4 | 0.3 | 14.2 |
| Kansas | 264,227 | 2,863,813 | 10.4 | -0.4 | 12.4 |
| Virginia | 774,978 | 8,037,736 | 10.5 | 0.4 | 9.1 |
| Maryland | 538,394 | 5,789,929 | 11.4 | 0.4 | 22.1 |
| Hawaii | 135,511 | 1,366,862 | 11.6 | 0.6 | 16.7 |
| Alaska | 76,488 | 721,523 | 12 | 2.4 | 13.4 |
| Iowa | 337,169 | 3,053,787 | 12 | 1.4 | 8.5 |
| Nevada | 266,276 | 2,709,432 | 12.1 | 0 | 22.7 |
| Massachusetts | 740,985 | 6,559,644 | 12.3 | 0.5 | 8.8 |
| South Dakota | 94,378 | 819,761 | 12.4 | -0.1 | 7.6 |
| Montana | 112,487 | 994,416 | 12.5 | 0.7 | 10.6 |
| Indiana | 804,477 | 6,501,582 | 13.4 | -0.1 | 8.3 |
| Pennsylvania | 1,564,824 | 12,734,905 | 13.4 | 0.3 | 8.8 |
| Wisconsin | 712,201 | 5,698,230 | 13.9 | 0.7 | 11.4 |
| Illinois | 1,607,496 | 12,864,380 | 14 | -0.1 | 12.1 |
| U.S. total | 39,588,798 | 309,183,463 | 14.3 | 0 | 11.6 |
| Idaho | 191,703 | 1,573,499 | 14.5 | 0.6 | 18.9 |
| Vermont | 85,276 | 630,337 | 14.7 | 0.8 | 8.5 |
| Delaware | 108,291 | 900,877 | 14.8 | 0.5 | 22.9 |
| Rhode Island | 138,007 | 1,055,247 | 15.1 | 2.3 | 15.4 |
| New York | 2,712,437 | 19,421,055 | 15.3 | 0.1 | 9.7 |
| Texas | 3,482,601 | 25,268,418 | 15.4 | -0.8 | 11.9 |
| Washington | 928,849 | 6,753,369 | 15.5 | 0.5 | 12.8 |
| Missouri | 894,754 | 6,011,478 | 15.6 | -0.4 | 5.1 |
| Ohio | 1,580,984 | 11,568,495 | 15.6 | 0.1 | 14.3 |
| Arizona | 1,006,005 | 6,412,700 | 16.1 | -0.9 | 2.4 |
| Florida | 2,523,454 | 18,900,773 | 16.1 | -0.1 | 20.6 |
| Oklahoma | 572,738 | 3,764,882 | 16.1 | -1.6 | 5.7 |
| North Carolina | 1,317,368 | 9,565,781 | 16.2 | 0.4 | 17.7 |
| Arkansas | 460,754 | 2,926,229 | 16.5 | -1.1 | 4.8 |
| Georgia | 1,562,209 | 9,727,566 | 17.9 | 0.3 | 11.7 |
| Alabama | 791,430 | 4,802,982 | 18 | 0 | 9.3 |
| South Carolina | 785,735 | 4,645,975 | 18.1 | 0.7 | 7.1 |
| Maine | 227,110 | 1,333,074 | 18.4 | -0.7 | 8 |
| West Virginia | 337,656 | 1,859,815 | 18.6 | 0.6 | 2.4 |
| Kentucky | 768,927 | 4,350,606 | 18.7 | -0.8 | 5.9 |
| Louisiana | 810,457 | 4,553,962 | 19.1 | 0.7 | 7.5 |
| Michigan | 1,747,094 | 9,911,626 | 19.6 | 0 | 11.4 |
| New Mexico | 346,141 | 2,067,273 | 19.7 | 0.1 | 17.9 |
| Tennessee | 1,202,604 | 6,375,431 | 19.9 | -0.5 | 5.2 |
| Oregon | 701,725 | 3,848,606 | 20 | 0.6 | 9.6 |
| Mississippi | 566,261 | 2,978,240 | 20.6 | -0.2 | 8.4 |
