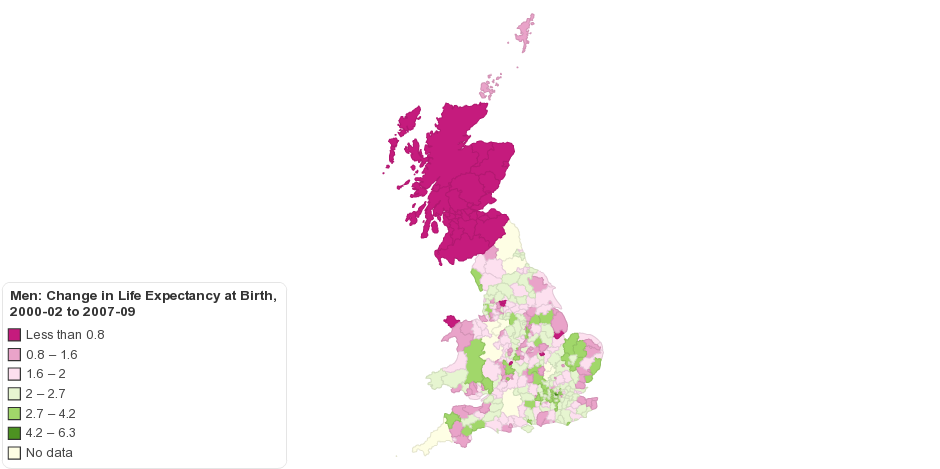
This map shows Men change in life expectancy at birth by United Kingdom Local authority, 2000-02 to 2007-09.
15 years ago
| Area name | Men 2000-2002 Life expectancy at birth | Men 2007-2009 Life expectancy at birth | Men Change, 2000-02 to 2007-09 |
|---|---|---|---|
| Buckinghamshire | 80.5 | ||
| Cambridgeshire | 79.8 | ||
| Cumbria | 78.1 | ||
| Derbyshire | 78.3 | ||
| Devon | 79.7 | ||
| Dorset | 80.3 | ||
| East Sussex | 79.5 | ||
| Essex | 79.6 | ||
| Gloucestershire | 79.3 | ||
| Hampshire | 80.2 | ||
| Hertfordshire | 79.6 | ||
| Kent | 78.8 | ||
| Lancashire | 77.1 | ||
| Leicestershire | 79.7 | ||
| Lincolnshire | 78.3 | ||
| Norfolk | 79.2 | ||
| Northamptonshire | 78.3 | ||
| North Yorkshire | 79.3 | ||
| Nottinghamshire | 78.2 | ||
| Oxfordshire | 79.7 | ||
| Somerset | 79.4 | ||
| Staffordshire | 78.2 | ||
| Suffolk | 79.6 | ||
| Surrey | 80.5 | ||
| Warwickshire | 78.6 | ||
| West Sussex | 79.4 | ||
| Worcestershire | 78.8 | ||
| ENGLAND | 78.3 | ||
| NORTHERN IRELAND | 76.8 | ||
| SCOTLAND | 75.4 | ||
| WALES | 77.2 | ||
| UNITED KINGDOM | 77.9 | ||
| ENGLAND AND WALES | 78.1 | ||
| City of London4 | |||
| Barking and Dagenham | 74.7 | 76.5 | 1.8 |
| Barnet | 77.6 | 80.2 | 2.6 |
| Bexley | 77 | 79.4 | 2.4 |
| Brent | 75.9 | 78.8 | 2.9 |
| Bromley | 77.5 | 79.9 | 2.4 |
| Camden | 74.3 | 78 | 3.7 |
| Croydon | 76.7 | 79.5 | 2.8 |
| Ealing | 75.9 | 78.9 | 3 |
| Enfield | 76.9 | 79.1 | 2.2 |
| Greenwich | 74.2 | 75.8 | 1.6 |
| Hackney | 74.2 | 77.2 | 3 |
| Hammersmith and Fulham | 75.6 | 78.1 | 2.5 |
| Haringey | 74.7 | 76.6 | 1.9 |
| Harrow | 78.2 | 81.2 | 3 |
| Havering | 76.5 | 78.8 | 2.3 |
| Hillingdon | 76.2 | 78.6 | 2.4 |
| Hounslow | 75.1 | 77.8 | 2.7 |
| Islington | 73.5 | 75.4 | 1.9 |
| Kensington and Chelsea | 78.9 | 84.4 | 5.5 |
| Kingston upon Thames | 77.6 | 80.7 | 3.1 |
| Lambeth | 73.1 | 76.4 | 3.3 |
| Lewisham | 74.1 | 76.3 | 2.2 |
| Merton | 77.3 | 80.5 | 3.2 |
| Newham | 73.3 | 76.2 | 2.9 |
| Redbridge | 76.7 | 79.4 | 2.7 |
| Richmond upon Thames | 77.8 | 81 | 3.2 |
| Southwark | 73.7 | 77.8 | 4.1 |
| Sutton | 76.9 | 79.4 | 2.5 |
| Tower Hamlets | 72.7 | 76 | 3.3 |
| Waltham Forest | 74.3 | 77.1 | 2.8 |
| Wandsworth | 75.4 | 77.8 | 2.4 |
| Westminster | 77.1 | 83.4 | 6.3 |
| Bolton | 74.4 | 75.7 | 1.3 |
| Bury | 75 | 77.2 | 2.2 |
| Manchester | 71.4 | 74 | 2.6 |
| Oldham | 73.5 | 75.5 | 2 |
| Rochdale | 74.1 | 75.8 | 1.7 |
| Salford | 73.2 | 74.7 | 1.5 |
| Stockport | 75.9 | 78.1 | 2.2 |
| Tameside | 73.3 | 75.7 | 2.4 |
| Trafford | 76.4 | 78.6 | 2.2 |
| Wigan | 74.2 | 75.9 | 1.7 |
| Knowsley | 72.9 | 75.9 | 3 |
| Liverpool | 72.5 | 74.5 | 2 |
| St. Helens | 74.3 | 75.9 | 1.6 |
| Sefton | 74.9 | 77.2 | 2.3 |
| Wirral | 74.9 | 76.3 | 1.4 |
| Barnsley | 74.4 | 76.4 | 2 |
| Doncaster | 74.9 | 76.4 | 1.5 |
| Rotherham | 75.2 | 76.6 | 1.4 |
| Sheffield | 75.4 | 77.8 | 2.4 |
| Gateshead | 74 | 76.4 | 2.4 |
| Newcastle upon Tyne | 74 | 76.2 | 2.2 |
| North Tyneside | 75.1 | 76.8 | 1.7 |
| South Tyneside | 74 | 76.6 | 2.6 |
| Sunderland | 73.7 | 75.9 | 2.2 |
| Birmingham | 73.8 | 76.4 | 2.6 |
| Coventry | 75.3 | 76.8 | 1.5 |
| Dudley | 75.6 | 77.8 | 2.2 |
| Sandwell | 73.7 | 74.9 | 1.2 |
| Solihull | 77.1 | 80 | 2.9 |
| Walsall | 74.8 | 76.3 | 1.5 |
| Wolverhampton | 74.5 | 76.3 | 1.8 |
| Bradford | 74.2 | 76.4 | 2.2 |
| Calderdale | 75.4 | 77.3 | 1.9 |
| Kirklees | 75 | 76.7 | 1.7 |
| Leeds | 75.4 | 77.7 | 2.3 |
| Wakefield | 74.7 | 76.6 | 1.9 |
| Hartlepool UA | 73.1 | 75.4 | 2.3 |
| Middlesbrough UA | 73.5 | 75.7 | 2.2 |
| Redcar and Cleveland UA | 75.1 | 77.7 | 2.6 |
| Stockton-on-Tees UA | 75.2 | 76.9 | 1.7 |
| Darlington UA | 74.5 | 76.6 | 2.1 |
| County Durham UA | 76.9 | ||
| Northumberland UA | 78.5 | ||
| Cheshire East UA | 79.1 | ||
| Halton UA | 73.7 | 75 | 1.3 |
| Warrington UA | 75.5 | 77.6 | 2.1 |
| Cheshire West and Chester UA | 78.8 | ||
| Blackburn with Darwen UA | 73 | 74.4 | 1.4 |
| Blackpool UA | 71.7 | 73.7 | 2 |
| Kingston upon Hull, City of UA | 73.7 | 75.2 | 1.5 |
| East Riding of Yorkshire UA | 77.1 | 79.2 | 2.1 |
| North East Lincolnshire UA | 74.5 | 75.9 | 1.4 |
| North Lincolnshire UA | 75.5 | 77.5 | 2 |
| York UA | 76.9 | 79.6 | 2.7 |
| Derby UA | 75.6 | 77.5 | 1.9 |
| Leicester UA | 74.2 | 75.4 | 1.2 |
| Rutland UA | 79.5 | 80.4 | 0.9 |
| Nottingham UA | 73.3 | 75.2 | 1.9 |
| Herefordshire, County of UA | 77.3 | 79.1 | 1.8 |
| Telford and Wrekin UA | 75.7 | 77.4 | 1.7 |
| Shropshire UA | 78.8 | ||
| Stoke-on-Trent UA | 73.5 | 75.4 | 1.9 |
| Bath and North East Somerset UA | 77.9 | 80.1 | 2.2 |
| Bristol, City of UA | 75.4 | 77.2 | 1.8 |
| North Somerset UA | 77.2 | 79.6 | 2.4 |
| South Gloucestershire UA | 78.3 | 80.4 | 2.1 |
| Cornwall UA | 78.7 | ||
| Isles of Scilly UA4 | |||
| Plymouth UA | 75.5 | 77.2 | 1.7 |
| Torbay UA | 76.3 | 78 | 1.7 |
| Bournemouth UA | 75.9 | 78 | 2.1 |
| Poole UA | 78 | 79.4 | 1.4 |
| Swindon UA | 76.1 | 78.4 | 2.3 |
| Wiltshire UA | 79.5 | ||
| Peterborough UA | 75.1 | 77.2 | 2.1 |
| Luton UA | 75 | 77.2 | 2.2 |
| Bedford UA | 78.8 | ||
| Central Bedfordshire UA | 79.2 | ||
| Southend-on-Sea UA | 75.5 | 77.5 | 2 |
| Thurrock UA | 75.8 | 78.3 | 2.5 |
| Medway UA | 75 | 77.3 | 2.3 |
| Bracknell Forest UA | 76.4 | 79.7 | 3.3 |
| West Berkshire UA | 77.9 | 80.1 | 2.2 |
| Reading UA | 75.9 | 77.5 | 1.6 |
| Slough UA | 75.5 | 78.4 | 2.9 |
| Windsor and Maidenhead UA | 77 | 79.4 | 2.4 |
| Wokingham UA | 78.7 | 81.7 | 3 |
| Milton Keynes UA | 76.3 | 77.9 | 1.6 |
| Brighton and Hove UA | 74.9 | 77.1 | 2.2 |
| Portsmouth UA | 74.9 | 77.5 | 2.6 |
| Southampton UA | 75.8 | 78.4 | 2.6 |
| Isle of Wight UA | 76.8 | 79.1 | 2.3 |
| Isle of Anglesey / Ynys Môn | 76.1 | 76.7 | 0.6 |
| Gwynedd / Gwynedd | 76.4 | 77.3 | 0.9 |
| Conwy / Conwy | 75.5 | 77.1 | 1.6 |
| Denbighshire / Sir Ddinbych | 75.9 | 77.9 | 2 |
| Flintshire / Sir y Fflint | 76.2 | 78.1 | 1.9 |
| Wrexham / Wrecsam | 75.4 | 77.4 | 2 |
| Powys / Powys | 76.7 | 79.5 | 2.8 |
| Ceredigion / Ceredigion | 78.6 | 80.4 | 1.8 |
| Pembrokeshire / Sir Benfro | 75 | 77.3 | 2.3 |
| Carmarthenshire / Sir Gaerfyrddin | 75.1 | 77.3 | 2.2 |
| Swansea / Abertawe | 75.6 | 76.9 | 1.3 |
| Neath Port Talbot / Castell-nedd Port Talbot | 74 | 76.2 | 2.2 |
| Bridgend / Pen-y-bont ar Ogwr | 75.4 | 76.4 | 1 |
| The Vale of Glamorgan / Bro Morgannwg | 76.1 | 78.2 | 2.1 |
| Rhondda Cynon Taf / Rhondda Cynon Taf | 74 | 75.5 | 1.5 |
| Merthyr Tydfil / Merthyr Tudful | 73.3 | 74.6 | 1.3 |
| Caerphilly / Caerffili | 74.1 | 76.1 | 2 |
| Blaenau Gwent / Blaenau Gwent | 73.3 | 75.6 | 2.3 |
| Torfaen / Tor-faen | 75.5 | 76.8 | 1.3 |
| Monmouthshire / Sir Fynwy | 76.7 | 79.5 | 2.8 |
| Newport / Casnewydd | 74.5 | 76.7 | 2.2 |
| Cardiff / Caerdydd | 75.1 | 77 | 1.9 |
| Aberdeen City | 75.4 | 75.7 | 0.3 |
| Aberdeenshire | 77.5 | 78 | 0.5 |
| Angus | 76.8 | 76.9 | 0.1 |
| Argyll & Bute | 76.3 | 76.5 | 0.2 |
| Scottish Borders | 77.1 | 77.1 | 0 |
| Clackmannanshire | 74.5 | 75 | 0.5 |
| West Dunbartonshire | 72.1 | 72.5 | 0.4 |
| Dumfries & Galloway | 76.4 | 76.8 | 0.4 |
| Dundee City | 73.7 | 73.7 | 0 |
| East Ayrshire | 74.6 | 74.6 | 0 |
| East Dunbartonshire | 78 | 78.3 | 0.3 |
| East Lothian | 76.6 | 76.7 | 0.1 |
| East Renfrewshire | 77.4 | 77.8 | 0.4 |
| Edinburgh, City of | 76.5 | 76.9 | 0.4 |
| Falkirk | 75.1 | 75.9 | 0.8 |
| Fife | 75.9 | 76.1 | 0.2 |
| Glasgow City | 70.7 | 71.1 | 0.4 |
| Highland | 75.9 | 76.3 | 0.4 |
| Inverclyde | 72.8 | 73.1 | 0.3 |
| Midlothian | 76.3 | 76.6 | 0.3 |
| Moray | 76.4 | 76.7 | 0.3 |
| North Ayrshire | 73.8 | 74 | 0.2 |
| North Lanarkshire | 73.1 | 73.7 | 0.6 |
| Orkney Islands | 74.4 | 75.5 | 1.1 |
| Perth & Kinross | 77.5 | 78.2 | 0.7 |
| Renfrewshire | 73.6 | 73.7 | 0.1 |
| Shetland Islands | 75 | 76.2 | 1.2 |
| South Ayrshire | 75.5 | 75.9 | 0.4 |
| South Lanarkshire | 74.5 | 74.9 | 0.4 |
| Stirling | 77 | 77.3 | 0.3 |
| West Lothian | 76 | 76 | 0 |
| Na h-Eileanan an Iar | 73.5 | 73.5 | 0 |
| Aylesbury Vale | 77.3 | 80.2 | 2.9 |
| Chiltern | 77.4 | 80.6 | 3.2 |
| South Bucks | 78.1 | 81.7 | 3.6 |
| Wycombe | 78 | 80.2 | 2.2 |
| Cambridge | 76.8 | 78.3 | 1.5 |
| East Cambridgeshire | 76.8 | 81 | 4.2 |
| Fenland | 74.7 | 77.2 | 2.5 |
| Huntingdonshire | 77.3 | 79.7 | 2.4 |
| South Cambridgeshire | 79 | 81.6 | 2.6 |
| Allerdale | 75.6 | 77.7 | 2.1 |
| Barrow-in-Furness | 74 | 77.1 | 3.1 |
| Carlisle | 75.5 | 77.1 | 1.6 |
| Copeland | 74.5 | 77.6 | 3.1 |
| Eden | 77.6 | 79.5 | 1.9 |
| South Lakeland | 77.6 | 79.3 | 1.7 |
| Amber Valley | 76 | 78.3 | 2.3 |
| Bolsover | 75.1 | 76.5 | 1.4 |
| Chesterfield | 74.9 | 77.1 | 2.2 |
| Derbyshire Dales | 77.7 | 80.1 | 2.4 |
| Erewash | 75.8 | 78.7 | 2.9 |
| High Peak | 76 | 78.8 | 2.8 |
| North East Derbyshire | 76.5 | 78.8 | 2.3 |
| South Derbyshire | 76.3 | 78.1 | 1.8 |
| East Devon | 77.6 | 80.7 | 3.1 |
| Exeter | 76.3 | 78.9 | 2.6 |
| Mid Devon | 78 | 80.2 | 2.2 |
| North Devon | 76.5 | 78 | 1.5 |
| South Hams | 78.6 | 79.9 | 1.3 |
| Teignbridge | 77.1 | 80.1 | 3 |
| Torridge | 76.3 | 79.7 | 3.4 |
| West Devon | 77.6 | 79.2 | 1.6 |
| Christchurch | 79 | 81 | 2 |
| East Dorset | 79.5 | 81.4 | 1.9 |
| North Dorset | 79.1 | 81.2 | 2.1 |
| Purbeck | 79.2 | 80.8 | 1.6 |
| West Dorset | 77.5 | 79.4 | 1.9 |
| Weymouth and Portland | 75.6 | 78.3 | 2.7 |
| Inner London | |||
| Outer London | |||
| Eastbourne | 75.3 | 78.7 | 3.4 |
| Hastings | 74.2 | 76.6 | 2.4 |
| Lewes | 78.7 | 80.9 | 2.2 |
| Rother | 77.4 | 79.5 | 2.1 |
| Wealden | 78.3 | 80.8 | 2.5 |
| Basildon | 76.5 | 79.1 | 2.6 |
| Braintree | 77.1 | 79.6 | 2.5 |
| Brentwood | 78.2 | 80.7 | 2.5 |
| Castle Point | 77.9 | 79.9 | 2 |
| Chelmsford | 77.8 | 80.3 | 2.5 |
| Colchester | 77.6 | 79.2 | 1.6 |
| Epping Forest | 77 | 79.4 | 2.4 |
| Harlow | 76 | 78 | 2 |
| Maldon | 77.4 | 78.9 | 1.5 |
| Rochford | 77.9 | 80.3 | 2.4 |
| Tendring | 76.1 | 79.2 | 3.1 |
| Uttlesford | 78.9 | 80.6 | 1.7 |
| Cheltenham | 77.3 | 80.2 | 2.9 |
| Cotswold | 78.3 | 80.2 | 1.9 |
| Forest of Dean | 76.2 | 78.7 | 2.5 |
| Gloucester | 75.9 | 77.8 | 1.9 |
| Stroud | 77.4 | 79.1 | 1.7 |
| Tewkesbury | 78.5 | 79.6 | 1.1 |
| Basingstoke and Deane | 77.1 | 80 | 2.9 |
| East Hampshire | 78.2 | 80.1 | 1.9 |
| Eastleigh | 77.5 | 79.9 | 2.4 |
| Fareham | 78.2 | 81.4 | 3.2 |
| Gosport | 75.8 | 78.9 | 3.1 |
| Hart | 79.5 | 81.2 | 1.7 |
| Havant | 77.1 | 79.3 | 2.2 |
| New Forest | 79.1 | 81 | 1.9 |
| Rushmoor | 76.2 | 79.4 | 3.2 |
| Test Valley | 77.7 | 79.6 | 1.9 |
| Winchester | 78.2 | 80.5 | 2.3 |
| Broxbourne | 77.4 | 79.8 | 2.4 |
| Dacorum | 77.9 | 80.5 | 2.6 |
| East Hertfordshire | 78 | 80 | 2 |
| Hertsmere | 77.3 | 78.9 | 1.6 |
| North Hertfordshire | 76.8 | 79.4 | 2.6 |
| St Albans | 78.3 | 80.9 | 2.6 |
| Stevenage | 76.3 | 77.4 | 1.1 |
| Three Rivers | 77.5 | 80.6 | 3.1 |
| Watford | 76.3 | 78.1 | 1.8 |
| Welwyn Hatfield | 77.3 | 79.3 | 2 |
| Ashford | 78 | 80.7 | 2.7 |
| Canterbury | 77 | 78.5 | 1.5 |
| Dartford | 76.3 | 78.9 | 2.6 |
| Dover | 76.1 | 77.4 | 1.3 |
| Gravesham | 76 | 78.4 | 2.4 |
