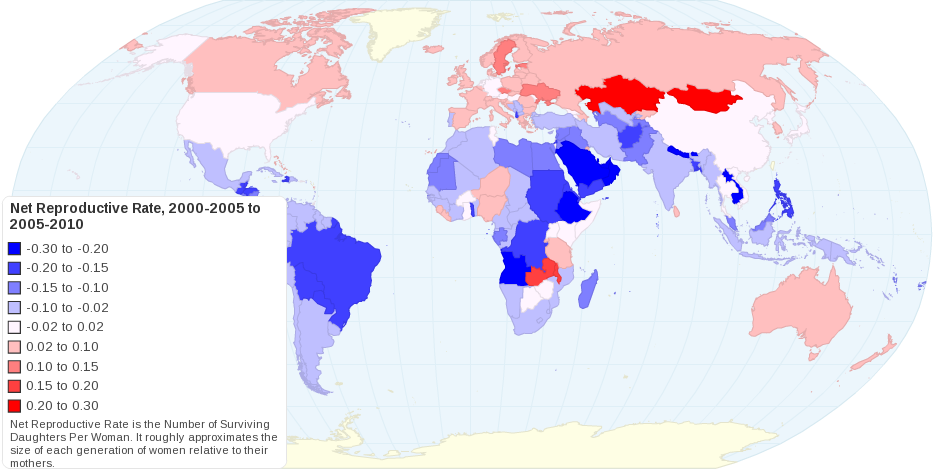
This maps the change in Net Reproductive Rate between the 5 year period at the beginning of the previous decade and the 5 year period that ended this decade. NRR represents the number of daughters the average woman has who will survive to child-bearing age. It effectively measures the size of each generation relative to the next. A value of 1 means each generation is the same size. This chart shows how this value is chaging across the world. Changes may be due to fertility rate changes or health / child survival rate changes.
14 years ago

