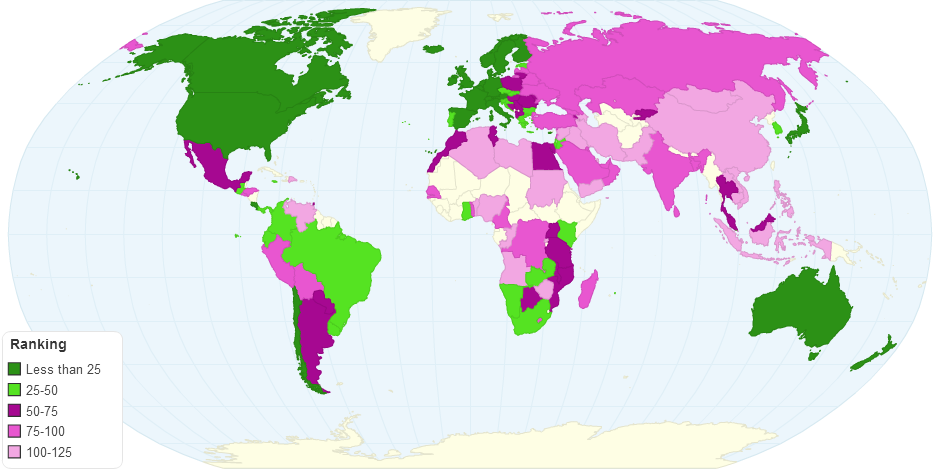
This chart shows the Good Country Index by Country.
The Good Country Index measures how much each of the 125 countries on the list contribute to the planet and to the human race through their policies and behaviours.
The Index is a composite statistic of 35 data points which are mostly generated by the United Nations. These data points are combined into a common measure which gives an overall ranking and a ranking in seven categories such as Science and Technology, Culture, International Peace and Security, World Order, Planet and Climate, Prosperity and Equality, Health and Wellbeing.
Categories and indicators :
Science, Technology & Knowledge:
1.Number of foreign students studying in the country relative to GDP.
2.Exports of periodicals, scientific journals and newspapers relative to GDP.
3.Number of articles published in international journals relative to GDP.
Culture:
1.Exports of creative goods relative to GDP.
2.Exports of creative services relative to GDP.
3.UNESCO dues in arrears as percentage of contribution.
International Peace and Security:
1.Number of peacekeeping troops sent overseas relative to GDP.
2.Dues in arrears to financial contribution to UN peacekeeping missions as percentage of contribution.
3.Attributed number of casualties of international organised violence relative to GDP.
World Order:
1.Percentage of population that gives to charity as proxy for cosmopolitan attitude.
2.Number of refugees hosted relative to GDP.
3.Number of refugees overseas relative to GDP.
Planet and Climate:
1.National Footprint Accounts Biocapacity reserve.
2.Exports of hazardous waste relative to GDP.
3.Organic water pollutant (BOD) emissions relative to GDP.
Prosperity and Equality:
1.Trading across borders.
2.Number of aid workers and volunteers sent overseas relative to GDP.
3.Fairtrade market size relative to GDP.
Prosperity and Equality:
1.Trading across borders.
2.Number of aid workers and volunteers sent overseas relative to GDP.
3.Fairtrade market size relative to GDP.
10 years ago

