Register to create your own interactive chart
|
Login »
Search
All
Country info
Drugs & Crime
Environment
Economic
Food & Agriculture
Health
Social
Society
More ▼
Education
Energy
Immigration
Infrastructure
Information & Communication Technology
People
Population
Religion
Sports
Tourism
Work
Others
Get free updates by Email
Get Email Updates!
Report an error
Follow us...
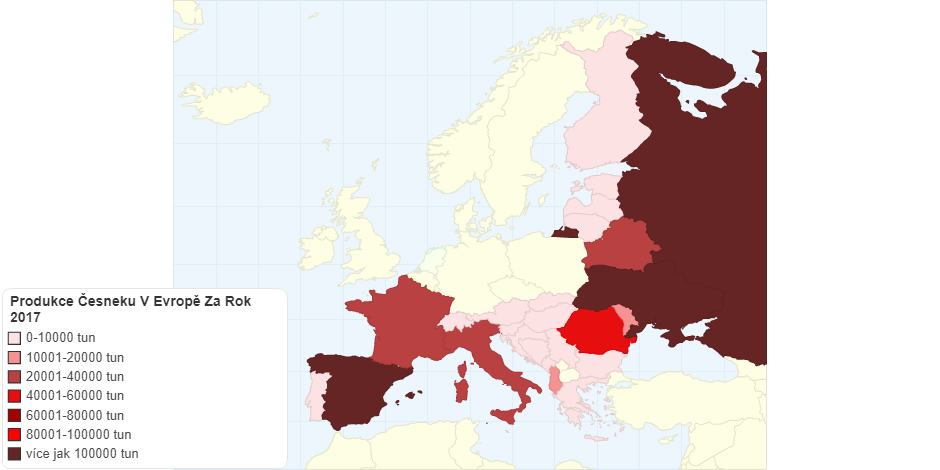
Produkce Česneku V Evropě Za Rok 2017
Hello, you have JavaScript turned off. Please enable JavaScript to see this interactive data visualization.
Do you like this chart?
✔ Yes
✖
✚ Share
References and Data Table
HTML Embed code
$ Buy Now
869
views
Tweet
Mapa produkce česneku v Evropě za rok 2017
Last updated:
7 years ago
Category:
Food & Agriculture
Tags:
česnek
garlic
Europe map
mapa Evropy
2017
References
Embed or download
Source
Produkce Česneku V Evropě Za Rok 2017
, faostat, viewed 25th October, 2019.
Citation
Produkce Česneku V Evropě Za Rok 2017
, ChartsBin.com, viewed 21st July, 2026, <http://chartsbin.com/view/47484>.
Read more »
Add new comment
Respond to this visualizations...
Loading...
Click here to view the discussion thread.
Related charts / graphs
Produkce cibule a česneku za rok 2017
0.00 rating | 964 views | 0 comments
Produkce Cukrové Třtiny Ve Světě Za Rok 2017
0.00 rating | 3,202 views | 0 comments
Počet chovaných ovcí v roce 2017 (Evropa)
0.00 rating | 894 views | 0 comments
Produkce jablek v Evropě od roku 2015 do roku 2017
0.00 rating | 893 views | 0 comments
You Might Also Like Our Friends' Posts
Copyright 2011 ChartsBin.com. All rights reserved.
About
|
Chat
|
Contact
|
Sign Up
|
Privacy
|
Legal
|
Feedback