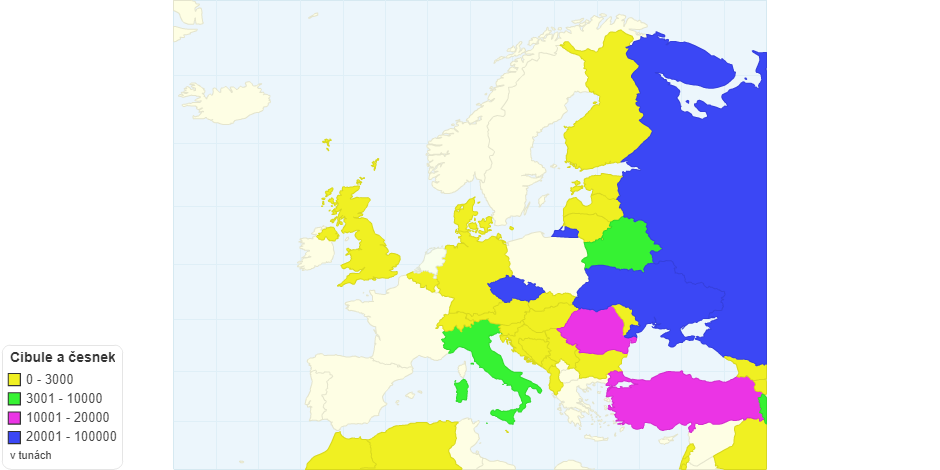
Produkce cibule a česneku za rok 2017
Do you like this chart?
✔ Yes
✖
✚ Share
References and Data Table
HTML Embed code
$ Buy Now
963 views
- Add new comment

Produkce Česneku V Evropě Za Rok 2017
0.00 rating | 869 views | 0 comments
Garlic Production Quantity 2012
5.00 rating | 1,934 views | 0 comments
Garlic Production Quantity by Country
4.06 rating | 13,486 views | 0 comments
Garlic Harvested Area by Country
5.00 rating | 7,183 views | 0 comments