-
Health
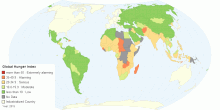
Global Hunger Index
This map shows Global Hunger Index (GHI) for 128 developing countries. The Global Hunger Index (GHI) is a tool adapted and further developed by the Internationa ...3.91 rating | 92,629 views | 5 Comments10 years ago -
Health
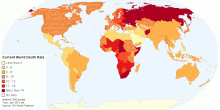
Current World Death Rate
This map shows current annual number of deaths during a year per 1,000 population at midyear; also known as crude death rate. Current World Death Rate: 7.9 deat ...3.93 rating | 46,470 views | 1 Comment14 years ago -
Health
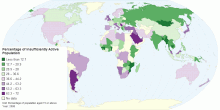
Percentage of Insufficiently Active Population
This map shows percentage of defined population(aged 15 or above; age-standardized estimate) attaining less than 5 times 30 minutes of moderate activity per week ...4.40 rating | 437,628 views | 2 Comments15 years ago -
Health
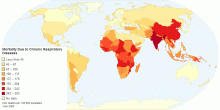
Mortality Due to Chronic Respiratory Diseases
The above map shows the age-standardized estimate of mortality by Chronic respiratory diseases per 100,000 people. Chronic respiratory diseases are chronic dise ...4.47 rating | 40,835 views | 1 Comment15 years ago -
Health
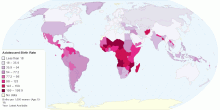
Adolescent Birth Rate
This map shows adolescent birth rate, that measures the annual number of births to women 15 to 19 years of age per 1,000 women in that age group. It represents t ...4.55 rating | 35,321 views | 3 Comments15 years ago -
Health
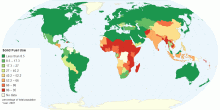
Household Solid Fuel Use
This Map shows the percentage of the total population that burn solid fuels in their households, primarily for cooking fuel. Solid fuels include coal or biomass ...4.63 rating | 23,024 views | 4 Comments15 years ago -
Health
Incidence of Tuberculosis per 100,000 population
This map shows the estimated number of Tuberculosis(TB) cases arising in a given time period (expressed here as rate per 100 000 population/year). All forms of T ...4.41 rating | 16,323 views | Discuss this15 years ago -
Health
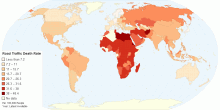
Estimated Road Traffic Fatal Injury Death Rate (Per ...
This chart shows the estimated number of road traffic deaths, per 100,000 population per year. WHO estimates about 1.2 million people die each year on the world ...4.55 rating | 53,395 views | 5 Comments15 years ago -
Health
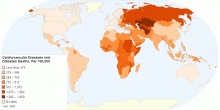
Mortality due to Cardiovascular Diseases and Diabetes
The above map shows the age-standardized estimate of mortality by Cardiovascular diseases and diabetes per 100,000 people. Heart disease or cardiovascular disea ...4.68 rating | 21,910 views | 2 Comments15 years ago -
Health
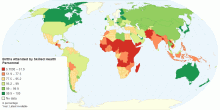
Percentage of Births Attended by Skilled Health Personnel
This map shows percentage of deliveries attended by health personnel(doctors, nurses or midwives) trained in providing life saving obstetric care, including givi ...4.31 rating | 18,816 views | 4 Comments15 years ago -
Health
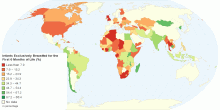
Percentage of Infants Exclusively Breastfed for the ...
This map shows percentage of Infants that are exclusively breastfed for the first six months of life. The World Health Organization (WHO) and the American Acade ...4.72 rating | 23,046 views | 2 Comments15 years ago -
Health
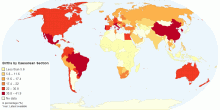
Percentage of Births by Caesarean Section
This map shows percentage of births by caesarean section among all live births in a given time period.4.63 rating | 38,388 views | Discuss this15 years ago -
Health
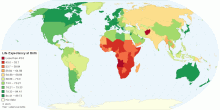
Current World Life Expectancy at Birth
This map shows current world life expectancy at birth. Life expectancy at birth is the expected average number of years to be lived by a group of people born in ...4.49 rating | 133,406 views | 2 Comments15 years ago -
Health
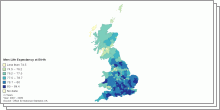
Current United Kindgom Life Expectancy at Birth
These page shows Men/Women life expectancy at birth and change in life expectancy at birth by United Kingdom Local authority for 2007-2009.3.67 rating | 4,845 views | Discuss this15 years ago -
Health
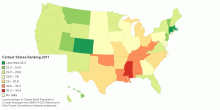
United States of Obesity: Fattest States Ranking - 2011
This map shows United States of obesity: 2011 Fattest States Ranking. The rankings use a three-year average in order to smooth out statistical fluctuations. For ...4.19 rating | 186,588 views | 15 Comments15 years ago