-
Health
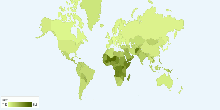
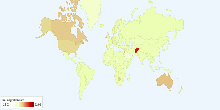
Current World Birth Rate
This chart shows current world birth rate. Current World Birth Rate: 19.95 births/1,000 people This entry gives the average annual number of births during a ye ...3.59 rating | 45,867 views | 5 Comments16 years ago -
Health
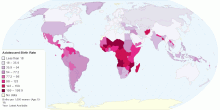
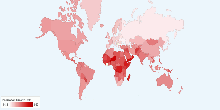
Adolescent Birth Rate
This map shows adolescent birth rate, that measures the annual number of births to women 15 to 19 years of age per 1,000 women in that age group. It represents t ...4.54 rating | 34,124 views | 3 Comments14 years ago -
Health
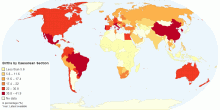
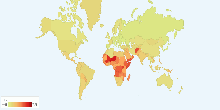
Percentage of Births by Caesarean Section
This map shows percentage of births by caesarean section among all live births in a given time period.4.63 rating | 37,177 views | Discuss this14 years ago -
Health
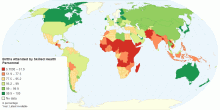
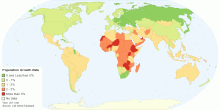
Percentage of Births Attended by Skilled Health Personnel
This map shows percentage of deliveries attended by health personnel(doctors, nurses or midwives) trained in providing life saving obstetric care, including givi ...4.31 rating | 17,726 views | 4 Comments14 years ago -
People
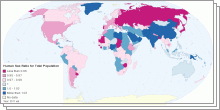
World Sex Ratio 2011
This collection of interactive maps shows Sex Ratio in five age groups - at birth, under 15 years, 15-64 years, 65 years and over, and for the total population. ...4.01 rating | 216,563 views | 3 Comments14 years ago -
Health
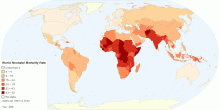
Current Worldwide Neonatal Mortality Rate (per 1000 ...
This map shows World Neonatal mortality rate. Neonatal mortality rate defined as number of deaths during the first 28 completed days of life per 1000 live births ...4.57 rating | 30,106 views | Discuss this14 years ago -
Health
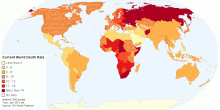
Current World Death Rate
This map shows current annual number of deaths during a year per 1,000 population at midyear; also known as crude death rate. Current World Death Rate: 7.9 deat ...3.97 rating | 40,092 views | 1 Comment13 years ago -
Health
Current World Death Rate
This chart shows current world death rate. Current World Death Rate: 8.23 deaths/1,000 people4.05 rating | 18,248 views | 1 Comment16 years ago -
Immigration
Migration Rate by Country
This chart shows migration rate by country (migrant(s)/1,000 population).4.24 rating | 16,492 views | Discuss this16 years ago -
Population
Current World Population Growth Rate
This chart shows current world population growth rate. Current World Population Growth Rate: 1.17%3.42 rating | 48,078 views | 7 Comments16 years ago -
Population
Current World Population Growth Rate
This map shows current world population growth rate. Current World Population Growth Rate: 1.092% (2011 est.) Population growth is the change in a population o ...4.29 rating | 29,892 views | Discuss this14 years ago -
Health
Current World Total Fertility Rate
This chart shows current world total fertility rate. Current World Total Fertility Rate: 2.58 children born/woman over her lifetime3.46 rating | 19,123 views | Discuss this16 years ago -
Economic
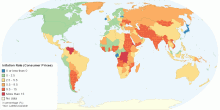
Current Inflation Rate (Consumer Prices) by Country
This map shows current Inflation Rate (consumer prices) by country. It is the annual percent change in consumer prices compared with the previous year's cons ...4.70 rating | 41,463 views | 1 Comment14 years ago -
Health
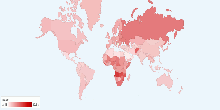
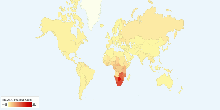
Current World HIV/AIDS Adult Prevalence Rate
This chart shows current world HIV/AIDS adult prevalence rate. Current World HIV/AIDS Adult Prevalence Rate: 0.8% (an estimate of the percentage of adults (aged ...4.31 rating | 15,716 views | 3 Comments16 years ago -
Health
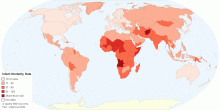
Current World Infant Mortality Rate
This map shows current world infant mortality rate. Infant mortality rate means the number of deaths of infants under one year old in a given year per 1,000 live ...4.36 rating | 34,667 views | Discuss this14 years ago
