-
Health
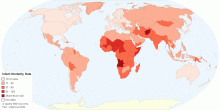
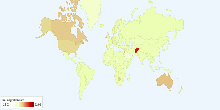
Current World Infant Mortality Rate
This map shows current world infant mortality rate. Infant mortality rate means the number of deaths of infants under one year old in a given year per 1,000 live ...4.36 rating | 34,372 views | Discuss this14 years ago -
Health
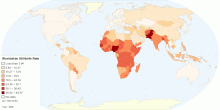
Current Worldwide Stillbirth Rate (per 1000 births)
This map shows Worldwide Stillbirth rate (per 1000 births). Stillbirth is the term used to describe the loss of a pregnancy or the birth of an infant that has di ...4.70 rating | 78,589 views | Discuss this14 years ago -
Health
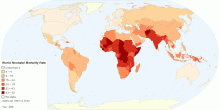
Current Worldwide Neonatal Mortality Rate (per 1000 ...
This map shows World Neonatal mortality rate. Neonatal mortality rate defined as number of deaths during the first 28 completed days of life per 1000 live births ...4.57 rating | 29,888 views | Discuss this14 years ago -
Health
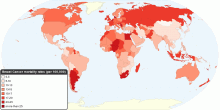
Current Worldwide Cancer Mortality Rate
This chart shows current worldwide Cancer Age-standardized Mortality Rate. Cancer is a leading cause of death worldwide: it accounted for 7.4 million deaths (aro ...4.21 rating | 29,553 views | 4 Comments16 years ago -
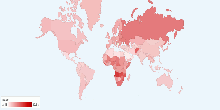
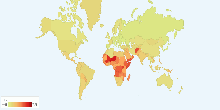
Health
Current Worldwide Breast Cancer Mortality Rate
This map shows current worldwide Breast Cancer Age-standardised mortality rates. Breast cancer is by far the most frequent cancer among women with an estimated 1 ...4.57 rating | 38,552 views | 1 Comment15 years ago -
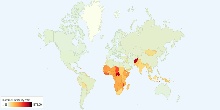
Health
Current Worldwide Maternal Mortality Rate
This chart shows current worldwide Maternal Mortality Rate per 100,000 live births. Current World Maternal mortality rates (2008): 251 per 100,000 live births ...4.33 rating | 42,333 views | Discuss this15 years ago -
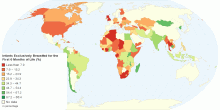
Health
Percentage of Infants Exclusively Breastfed for the ...
This map shows percentage of Infants that are exclusively breastfed for the first six months of life. The World Health Organization (WHO) and the American Acade ...4.71 rating | 22,108 views | 2 Comments14 years ago -
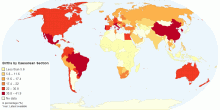
Health
Percentage of Births by Caesarean Section
This map shows percentage of births by caesarean section among all live births in a given time period.4.63 rating | 36,878 views | Discuss this14 years ago -
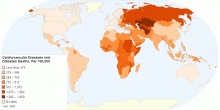
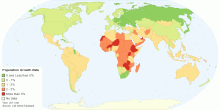
Health
Mortality due to Cardiovascular Diseases and Diabetes
The above map shows the age-standardized estimate of mortality by Cardiovascular diseases and diabetes per 100,000 people. Heart disease or cardiovascular disea ...4.68 rating | 20,922 views | 2 Comments14 years ago -
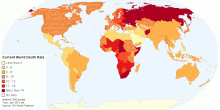
Health
Current World Death Rate
This map shows current annual number of deaths during a year per 1,000 population at midyear; also known as crude death rate. Current World Death Rate: 7.9 deat ...3.97 rating | 38,829 views | 1 Comment12 years ago -
Immigration
Migration Rate by Country
This chart shows migration rate by country (migrant(s)/1,000 population).4.24 rating | 16,245 views | Discuss this16 years ago -
Health
Current World Death Rate
This chart shows current world death rate. Current World Death Rate: 8.23 deaths/1,000 people4.05 rating | 18,083 views | 1 Comment16 years ago -
Health
Current World Birth Rate
This chart shows current world birth rate. Current World Birth Rate: 19.95 births/1,000 people This entry gives the average annual number of births during a ye ...3.59 rating | 45,663 views | 5 Comments16 years ago -
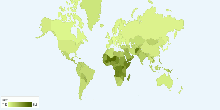
Population
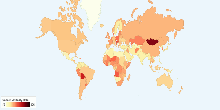
Current World Population Growth Rate
This map shows current world population growth rate. Current World Population Growth Rate: 1.092% (2011 est.) Population growth is the change in a population o ...4.28 rating | 29,446 views | Discuss this14 years ago -
Health
Current World Total Fertility Rate
This chart shows current world total fertility rate. Current World Total Fertility Rate: 2.58 children born/woman over her lifetime3.46 rating | 18,936 views | Discuss this16 years ago