-
Energy
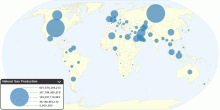
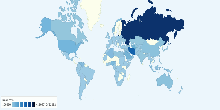
Current Worldwide Natural Gas Production
This chart shows current Natural Gas Production in the world. Current Natural Gas Production in the World: 3,065,690,558,538 cubic meters (cu m)3.81 rating | 19,023 views | Discuss this16 years ago -
Energy
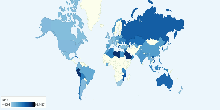
Current Worldwide Reserves-to-production ratio of N ...
This chart shows the Current Worldwide Reserves-to-production ratio of Natural Gas. Current World Reserves-to-production ratio of Natural Gas: 60.35 Years What ...4.13 rating | 14,249 views | 1 Comment16 years ago -
Energy
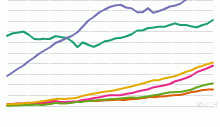
Historical Natural Gas Production by Region, 1970 t ...
This chart shows the historical Natural Gas Production - 1970 onwards. List of countries included in each region: North America includes United States,Canad ...4.11 rating | 11,932 views | Discuss this16 years ago -
Energy
Historical World Reserves-to-production ratio of Na ...
This chart shows the Historical World Reserves-to-production ratio of Natural Gas - 1980 onwards. Current World Reserves-to-production ratio of Natural Gas: 60. ...5.00 rating | 9,797 views | Discuss this16 years ago -
Health
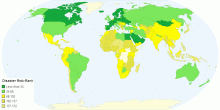
Natural Disaster Risk 2015
This chart shows the Natural Disaster Risk 2015 by country. A natural disaster is a major adverse event resulting from natural processes of the Earth; examples ...4.33 rating | 10,561 views | Discuss this9 years ago -
Energy
Current Worldwide Natural Gas reserves
This chart shows current Natural Gas reserves in the world. Current Natural Gas reserves in the World: 184,573,964,748,442 cubic meters (cu m or m³)4.11 rating | 21,425 views | 20 Comments16 years ago -
Energy
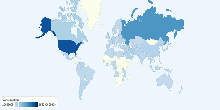
Current Worldwide Natural Gas Consumption
This chart shows current Natural Gas Consumption in the world. Current Natural Gas Consumption in the World: 3,015,443,467,227 cubic meters (m³)4.03 rating | 12,999 views | 4 Comments16 years ago -
Energy
Current Worldwide Natural Gas Consumption per capita
This chart shows current Natural Gas Consumption in the world. Current Natural Gas Consumption in the World: 444.1 cubic meters (m³) per capita4.13 rating | 12,498 views | Discuss this16 years ago -
Energy
Historical Natural Gas Consumption by Region, 1965 ...
This chart shows the historical Natural Gas Consumption - 1965 onwards. List of countries included in each region: North America includes United States,Cana ...4.37 rating | 12,514 views | Discuss this16 years ago -
Food & Agriculture
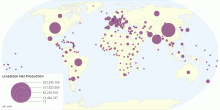
Livestock Net Production by Country
This chart shows livestock net production by country. Livestock are domesticated animals raised in an agricultural setting to produce commodities such as food, ...4.11 rating | 5,810 views | Discuss this10 years ago -
Infrastructure
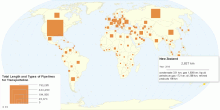
Total Length of Pipelines for Transportation by Country
This map shows list of countries by total length and types of pipelines for transporting products like natural gas, crude oil, or petroleum products. World Tota ...4.42 rating | 38,824 views | Discuss this14 years ago -
Food & Agriculture
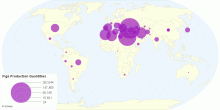
Figs Production Quantities by Country
This Charts Shows Figs Production Quantities by Country Ficus carica is an Asian species of flowering plants in the mulberry family, known as the common fig. It ...4.33 rating | 4,411 views | Discuss this9 years ago -
Food & Agriculture
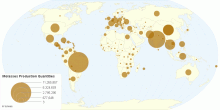
Molasses Production Quantities by Country
This Charts Shows Molasses Production Quantities by Country Molasses is a viscous by-product of the refining of sugarcane or sugar beets into sugar. The word co ...3.44 rating | 4,380 views | Discuss this9 years ago -
Country Info
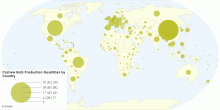
Cashew Nuts Production Quantities by Country
This Charts shows the Cashew nuts Production Quantities by Country The cashew tree is a tropical evergreen tree that produces the cashew seed and the cashe ...3.88 rating | 19,002 views | Discuss this9 years ago -
Food & Agriculture
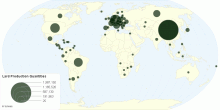
Lard Production Quantities by Country
This charts shows Lard Production Quantities by Country Lard is pig fat in both its rendered and unrendered forms. It is obtained from any part of the pig where ...5.00 rating | 4,289 views | Discuss this9 years ago