-
Social
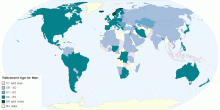
What is the Statutory Retirement Age for Men in the ...
This map shows the statutory retirement age for men in the private sector. The statutory retirement age is the age at which men working in the private sector can ...4.16 rating | 188,508 views | Discuss this15 years ago -
People
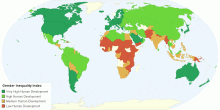
Gender Inequality Index(GII)
This chart shows the Global Inequality Index(GII) by Country. The Gender Inequality Index (GII) reflects women’s disadvantage in three dimensions—re ...4.14 rating | 172,568 views | 11 Comments10 years ago -
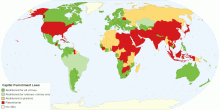
Drugs & Crime
World Prison Population Rates per 100,000 of the na ...
This map shows world prison population rates per 100,000 of the national population. Current world prison population rate: 168 per 100,000 people Current world ...4.41 rating | 113,561 views | 5 Comments16 years ago -
Social
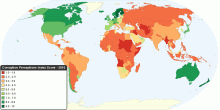
Corruption around the World
This chart shows Corruption Perceptions Index (CPI) around the world. The CPI index score on a scale from 10 (very clean) to 0 (highly corrupt). 2010 CPI key fi ...4.52 rating | 90,902 views | 8 Comments16 years ago -
Education
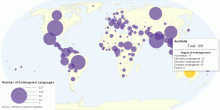
Number of Endangered Languages by Country
This map shows the number of endangered languages in each country. Total number of endangered languages in the world: 3074 Vulnerable: 725 Definitely endang ...4.17 rating | 79,047 views | 3 Comments15 years ago -
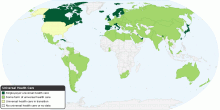
Health
Universal Health Care around the World
This map shows Universal health care around the world. Universal health care is a national health insurance program in many countries that is mostly financed by ...4.36 rating | 74,740 views | 5 Comments16 years ago -
Country Info
Capital Punishment Around the World
This chart shows use of capital punishment or the death penalty around the world. In 2010 one more African country, Gabon, abolished the death penalty, bringing ...4.46 rating | 73,168 views | 5 Comments15 years ago -
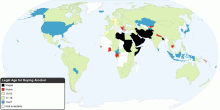
Country Info
Minimum Legal Age for Buying Alcohol around the World
This chart shows legal age for purchasing alcohol around the world.4.08 rating | 66,541 views | 12 Comments16 years ago -
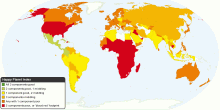
Environment
Happy Planet Index (HPI)
This map shows the overall scores from the second global compilation of the Happy Planet Index (HPI). The HPI is an index of human well-being and environmental i ...3.99 rating | 63,361 views | 9 Comments16 years ago -
Country Info
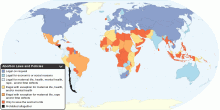
World Abortion Laws and Policies
This map shows world status of abortion laws and policies. Abortion law is legislation which pertains to the provision of abortion. Although it is commonly pract ...4.59 rating | 57,024 views | 8 Comments16 years ago -
Social
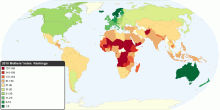
The Best and Worst Countries to Be a Mother
This map shows 2010 Mothers' Index around the world. The Mothers' Index helps document conditions for mothers and children in 160 countries (43 developed nations ...4.00 rating | 49,890 views | 8 Comments16 years ago -
Drugs & Crime
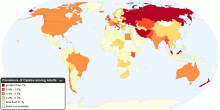
Current Worldwide Annual Prevalence of Opiates among Adults
This chart shows current worldwide annual prevalence of opiates in population aged 15-64. Number of people who used opiates at least once in year: 12.8 - 21.9 m ...4.56 rating | 46,971 views | 2 Comments16 years ago -
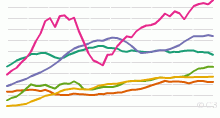
Energy
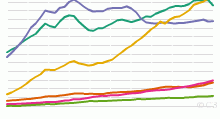
Historical Oil Consumption by Region, 1965 to Present
This chart shows the historical Oil Consumption in barrels per day - 1965 onwards. List of countries included in each region: North America includes United ...4.07 rating | 46,958 views | 2 Comments17 years ago -
Energy
Historical Oil Production by Region, 1965 to Present
This chart shows the historical Oil Production - 1965 onwards. List of countries included in each region: North America includes United States,Canada and Me ...4.41 rating | 45,644 views | 5 Comments17 years ago -
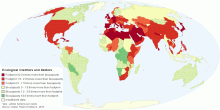
Environment
Ecological Creditors and Debtors
This map compares each country's total consumption Footprint with the biocapacity available within its own borders. World Total Biocapacity: 1.78 gha per ...3.80 rating | 44,886 views | Discuss this15 years ago