-
Economic
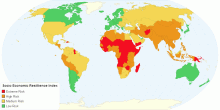
Socio Economic Resillience Index
This chart Shows Socio-economic Resillience Index by Country. Economic resilence is the ability of a local economy to retain function, employment and prosperit ...2.60 rating | 5,857 views | Discuss this10 years ago -
Country Info
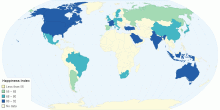
Happiness Index
World Happiness Index1.00 rating | 3,931 views | Discuss this10 years ago -
Energy
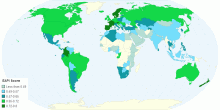
Global Energy Architecture Performance Index 2015
This chart shows the Global Energy Architecture Performance Index 2015.. The EAPI is a composite index that focuses on tracking specific indicators to measure ...5.00 rating | 4,895 views | Discuss this10 years ago -
Social
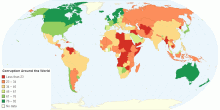
Corruption Around the World
This chart shows Corruption Perceptions Index (CPI) around the world. The CPI index score on a scale from 100 (very clean) to 0 (highly corrupt) What is the Cor ...4.03 rating | 14,667 views | Discuss this11 years ago -
Country Info
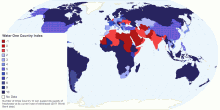
Water: One Country Index
World Bank data (2011) Reserve: Renewable internal freshwater resources (billion cubic meters) World Bank Withdrawal: Annual Freshwater Withdra ...3.29 rating | 5,345 views | Discuss this13 years ago -
Country Info
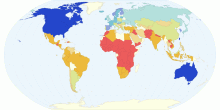
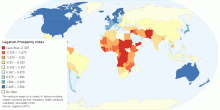
Legatum Prosperity Index Rankings
The ranking of countries in the 2012 Legatum Prosperity Index, a holistic representation of worldwide prosperity.2.33 rating | 5,269 views | Discuss this13 years ago -
Social
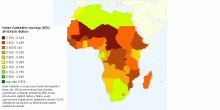
Index ľudského rozvoja (HDI) afrických štátov
Mapa zobrazuje 53 afrických štátov a ich rôzne indexi ľudského rozvoja. Podľa mapy vieme ľahko určiť, ktoré &s ...5.00 rating | 1,748 views | Discuss this5 years ago -
Food & Agriculture
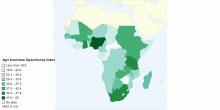
Agri Business Opportunities in Sub Sahara Africa
Index based on 20 selected indicators5.00 rating | 2,166 views | Discuss this14 years ago -
Country Info
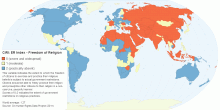
CIRI: ER Index - Freedom of Religion
This variable indicates the extent to which the freedom of citizens to exercise and practice their religious beliefs is subject to actual government restrictions ...3.18 rating | 7,163 views | Discuss this10 years ago -
Country Info
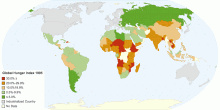
Global Hunger Index 1995
This map shows the hunger in 1995 with 155 countries2.33 rating | 4,789 views | Discuss this11 years ago -
Country Info
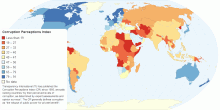
Corruption Perceptions Index
Transparency International (TI) has published the Corruption Perceptions Index (CPI) since 1995, annually ranking countries "by their perceiv ...5.00 rating | 3,551 views | Discuss this10 years ago -
Country Info
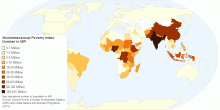
Multidimensional Poverty Index: Number in MPI
Map represents number of population in MPI. Source: Oxford Poverty & Human Development Initiative (OPHI) and United Nations Development Programme (2015)3.35 rating | 5,659 views | Discuss this10 years ago -
Country Info
Legatum Prosperity Index
The ranking is based on a variety of factors including wealth, economic growth, education, health, personal well-being, and quality of life. Source: Legatum (2015)0.00 rating | 4,017 views | Discuss this10 years ago -
Country Info
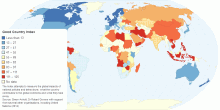
Good Country Index
The Index attempts to measure the global impacts of national policies and behaviours: what the country contributes to the global commons and what they take away. ...2.89 rating | 10,468 views | Discuss this10 years ago -
Country Info
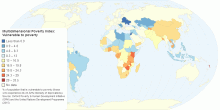
Multidimensional Poverty Index: Vulnerable to poverty
% of population that is vulnerable to poverty (those who experience 20-33.32% intensity of deprivations). Source: Oxford Poverty & Human Development Initiat ...3.40 rating | 3,713 views | Discuss this10 years ago