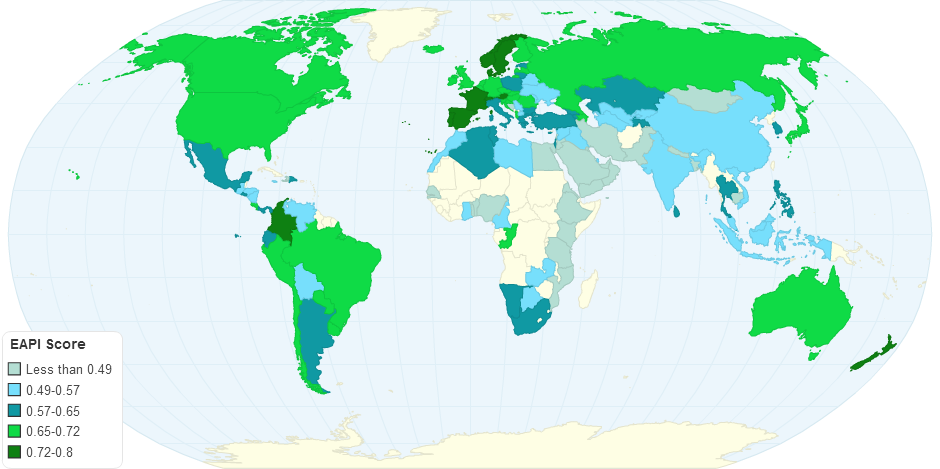
This chart shows the Global Energy Architecture Performance Index 2015..
The EAPI is a composite index that focuses on tracking specific indicators to measure the energy system performance of 125 countries.At its core are 18 indicators defined across each side of the energy triangle: economic growth and development, environmental sustainability, and energy access and security. Scores and rankings are calculated for each of these indicators.
Energy Architecture is an architectural, design, drafting and sustainability consultancy practice with both Adelaide Architects & Mildura Architects.
Economic growth and development:
Despite substantial policy efforts worldwide, progress in improving the energy intensity of economies is lagging especially in emerging economies. Strong performance on the EAPI’s energy intensity indicator is one of the principle differentiators for countries overall performance on the economic growth and development sub-index. Energy intensity is a function of energy efficiency, as well as the underlying structure of an economy.
Environmental sustainability:
While advanced economies are gradually moving to a less carbon-intensive energy architecture, for many countries the future is less promising. Despite some progress on the environmental sustainability sub-index for many economies, much more needs to be done for the world to move to a low-carbon energy system. For over one-third of countries on the EAPI, the share of non-carbon sources in total primary energy supply remains lower than 10%. For top performers, the share is closer to 40%. Varying efforts to address rising greenhouse gas emissions are particularly visible within the indicator on carbon dioxide emissions from the electricity sector: the average emissions for BRICs is 531 grams of CO2 per kilowatt hour of electricity produced, compared to 394g for advanced economies.
Energy access and security:
Import dependence is growing across many energy systems, but this is being addressed through increased supply diversity. Of the 125 countries on the EAPI, 67% are net energy importers. The top performers on the energy access and security sub-index demonstrate that import dependence can be addressed both through diversity in the energy mix, and in the number of energy trading partners. This can help mitigate energy supply disruption risks – a point further underlined by recent geopolitical insecurity.
10 years ago
