-
People
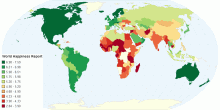
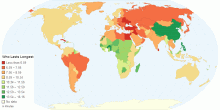
World Happiness Index
This chart shows the World Happiness Report 2015. The World Happiness Report is a measure of happiness published by the United Nations Sustainable Development S ...4.36 rating | 17,417 views | Discuss this9 years ago -
Social
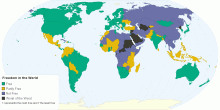
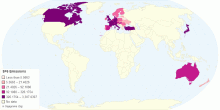
Freedom in the World
This map shows Freedom in the World in 2015. Free: 89 countries Partly Free: 54 countries Not Free: 42 countries Worst of the Worst: 9 countries ...3.95 rating | 173,301 views | Discuss this9 years ago -
Social
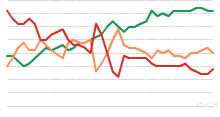
Historical Freedom in the World, 1972 to Present
This chart shows historical Freedom in the World - 1972 onwards. What is Freedom in the World? and How is the Freedom of the World calculated? Note: 1982: T ...3.61 rating | 14,767 views | Discuss this15 years ago -
Food & Agriculture
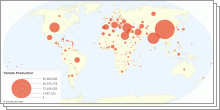
Tomato Production and Consumption by country.
This map shows tomato production and consumption by country. The tomato is now grown worldwide for its edible fruits, with thousands of cultivars having been se ...4.24 rating | 24,212 views | 1 Comment10 years ago -
Food & Agriculture
Dates Consumption By Country
This map shows dates consumption by country. Dates are a good source of various vitamins and minerals. Its a good source of energy, sugar and fiber. Essential m ...4.04 rating | 11,442 views | Discuss this10 years ago -
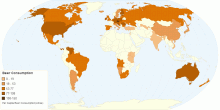
Drugs & Crime
Beer Consumption by Country
This map shows per capita beer consumption by country. The Czech Republic led all other nations in per-capita beer consumption for the 20th consecutive ...4.30 rating | 22,732 views | Discuss this10 years ago -
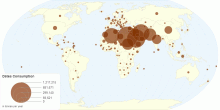
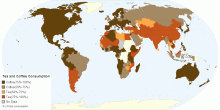
Country Info
Tea and Coffee Consumption
This map shows tea and coffee consumption details.4.30 rating | 15,233 views | Discuss this10 years ago -
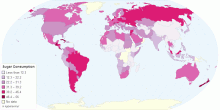
Country Info
Who Has the Sweetest Tooth ?
This map shows sugar consumption per person.4.29 rating | 8,246 views | Discuss this10 years ago -
Country Info
Who Lasts the Longest?
This Map shows how long on average Porhub users around the world spend on the site by country. The data used was compiled over the Fall of 2014.4.24 rating | 24,195 views | Discuss this10 years ago -
Others
Sulphur Hexafluoride SF6 Emissions by country
This chart shows the Sulphur hexafluoride (SF6) Emissions by country. Sulfur hexafluoride (SF6) is an inorganic, colorless, odorless, non-flammable, extremely p ...5.00 rating | 3,965 views | Discuss this9 years ago -
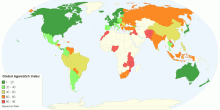
Health
Global Agewatch Index
This chart shows the Global AgeWatch Index 2015. The Global AgeWatch Index provides an analysis of results by region. It measures four key domains for older peo ...4.05 rating | 9,936 views | Discuss this9 years ago -
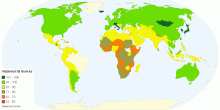
Education
National IQ Scores
This chart shows the IQ Scores by Country. An intelligence quotient (IQ) is a score derived from one of several standardized tests designed to assess human inte ...4.27 rating | 67,908 views | Discuss this9 years ago -
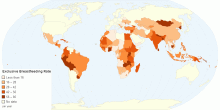
People
Exclusive Breastfeeding Rate by Country
This chart shows exclusive breastfeeding rate by country. Breastfeeding or nursing is feeding of babies and young children with milk from a female breast.Breast ...3.53 rating | 6,672 views | Discuss this10 years ago -
Economic
Economic Gross Value Added Activity by Country
This charts shows economic gross value added activity by country. Gross value added (GVA) is a measure in economics of the value of goods and services produced ...3.00 rating | 8,707 views | 2 Comments10 years ago -
Others
Inflation GDP Deflator by country.
This chart shows inflation GDP deflator by country. Inflation as measured by the annual growth rate of the GDP implicit deflator shows the rate of price change ...4.00 rating | 7,114 views | Discuss this10 years ago