-
Country Info
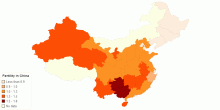
Fertility in China
Fertility rates in China's provinces, data from 2014.0.00 rating | 2,885 views | Discuss this10 years ago -
Health
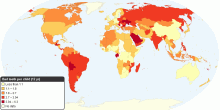
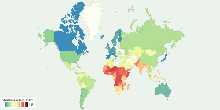
Bad teeth per child (12 yr)
The weighted average of the number of Decayed (D), Missing (M), Filled (F) teeth (T) among the 12 years old in a country (DMFT). It is meant to reflect the preva ...3.29 rating | 7,127 views | Discuss this14 years ago -
Health
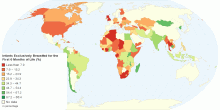
Percentage of Infants Exclusively Breastfed for the ...
This map shows percentage of Infants that are exclusively breastfed for the first six months of life. The World Health Organization (WHO) and the American Acade ...4.71 rating | 22,125 views | 2 Comments14 years ago -
Health
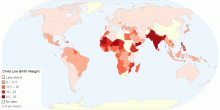
Child Low Birth Weight by Country
This map shows child low birth weight by country. Low birth weight (LBW) is defined as a birth weight of a liveborn infant of less than 2,500 g (5 pounds 8 ounc ...4.69 rating | 6,904 views | Discuss this10 years ago -
Social
World Child Development Index
This chart shows the Child Development Index (CDI) around the world. World Performance CDI Score: 17.5 Time period: 2000-2006 Education: 11.4 H ...4.22 rating | 28,259 views | Discuss this15 years ago -
Social
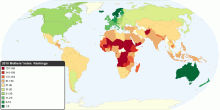
The Best and Worst Countries to Be a Mother
This map shows 2010 Mothers' Index around the world. The Mothers' Index helps document conditions for mothers and children in 160 countries (43 developed nations ...4.05 rating | 48,243 views | 8 Comments15 years ago -
Health
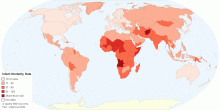
Current World Infant Mortality Rate
This map shows current world infant mortality rate. Infant mortality rate means the number of deaths of infants under one year old in a given year per 1,000 live ...4.36 rating | 34,390 views | Discuss this14 years ago -
Society
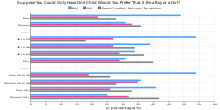
Suppose You Could Only Have One Child. Would You Pr ...
This charts shows the result of recent survey (asked to Americans) conducted by Gallup poll about gender preferences: Suppose you could only have one child. Woul ...4.20 rating | 22,796 views | 2 Comments14 years ago -
Country Info
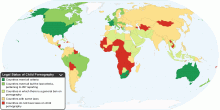
Legal Status of Child Pornography by Country
This map shows legal status of child pornography. Child pornography refers to images or films (also known as child abuse images) and in some cases writings depic ...4.04 rating | 1,053,420 views | 78 Comments15 years ago -
Health
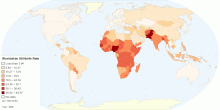
Current Worldwide Stillbirth Rate (per 1000 births)
This map shows Worldwide Stillbirth rate (per 1000 births). Stillbirth is the term used to describe the loss of a pregnancy or the birth of an infant that has di ...4.70 rating | 78,637 views | Discuss this14 years ago -
Health
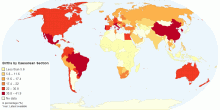
Percentage of Births by Caesarean Section
This map shows percentage of births by caesarean section among all live births in a given time period.4.63 rating | 36,903 views | Discuss this14 years ago -
Health
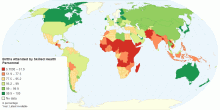
Percentage of Births Attended by Skilled Health Personnel
This map shows percentage of deliveries attended by health personnel(doctors, nurses or midwives) trained in providing life saving obstetric care, including givi ...4.31 rating | 17,533 views | 4 Comments14 years ago -
Social
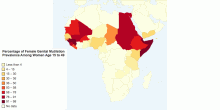
Percentage of Female Genital Mutilation Prevalence ...
Over 70 million girls and women aged 15–49 years in Africa and in Yemen have undergone FGM/C. Approximately 60 per cent of them live in sub-Saharan Africa, ...3.00 rating | 5,410 views | Discuss this13 years ago -
Health
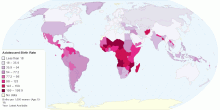
Adolescent Birth Rate
This map shows adolescent birth rate, that measures the annual number of births to women 15 to 19 years of age per 1,000 women in that age group. It represents t ...4.54 rating | 33,895 views | 3 Comments14 years ago -
Health
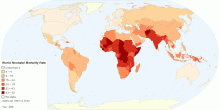
Current Worldwide Neonatal Mortality Rate (per 1000 ...
This map shows World Neonatal mortality rate. Neonatal mortality rate defined as number of deaths during the first 28 completed days of life per 1000 live births ...4.57 rating | 29,916 views | Discuss this14 years ago