-
Energy
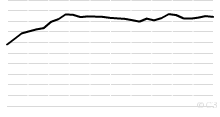
Historical Natural Gas Consumption by Region, 1965 ...
This chart shows the historical Natural Gas Consumption - 1965 onwards. List of countries included in each region: North America includes United States,Cana ...4.40 rating | 13,941 views | Discuss this17 years ago -
Energy
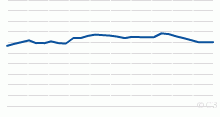
Historical World Reserves-to-production ratio of Oi ...
This chart shows the Historical World Reserves-to-production ratio of Oil - 1980 onwards. Current World Reserves-to-production ratio of Oil: 42.11 Years What D ...4.17 rating | 23,991 views | Discuss this17 years ago -
Energy
Historical World Reserves-to-production ratio of Na ...
This chart shows the Historical World Reserves-to-production ratio of Natural Gas - 1980 onwards. Current World Reserves-to-production ratio of Natural Gas: 60. ...5.00 rating | 10,800 views | Discuss this17 years ago -
Information and Communication Technology
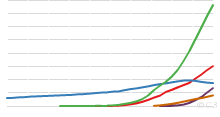
Number of Telephone Subscriptions and Internet Conn ...
This chart shows historical Number of Telephone subscriptions and Internet Connections per 100 people, World, 1975 to Present. Current World Fixed telephone ...4.59 rating | 22,470 views | Discuss this15 years ago -
Country Info
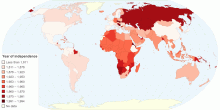
Worlds Independence
Independence3.00 rating | 4,157 views | Discuss this13 years ago -
People
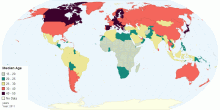
Global Median Age
This map shows the median age that divides a population into two numerically equal groups; that is, half the people are younger than this age and half are older. ...4.58 rating | 51,109 views | 2 Comments15 years ago -
Population
India's Population Density
This map shows India's population density in 2011 census. India's Population Density:382 persons per sq. km. (2011) India's Population Density: 325 ...4.01 rating | 67,033 views | 5 Comments15 years ago -
Population
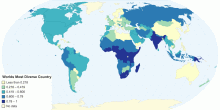
What is the world’s most diverse country?
When Sadiq Khan was voted in as London Mayor, he announced his city ‘the most diverse and fantastic in the world’. His claim triggered interest from ...3.40 rating | 4,842 views | Discuss this10 years ago -
Population
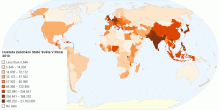
Hustota Zalidnění Států Světa V Roce 2010
population density in the world5.00 rating | 5,161 views | Discuss this12 years ago -
Population
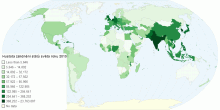
Hustota zalidnění státu světa roku 2010
Hustota zalidnění ve státech světa.0.00 rating | 4,367 views | Discuss this12 years ago -
Country Info
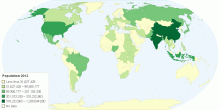
Population 2013
World population in 20134.43 rating | 9,626 views | Discuss this13 years ago -
Country Info
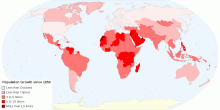
Population Growth: 1950 to 2011
Ratio of Populations, 2011 to 19505.00 rating | 4,083 views | Discuss this14 years ago -
Population
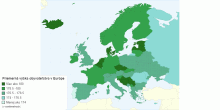
Priemerná výška obyvateľstva v Európe
Mapa zobrazuje priemernú výšku obyvateľstva v krajinách Európy.5.00 rating | 1,608 views | Discuss this6 years ago -
Social
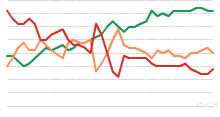
Historical Freedom in the World, 1972 to Present
This chart shows historical Freedom in the World - 1972 onwards. What is Freedom in the World? and How is the Freedom of the World calculated? Note: 1982: T ...3.67 rating | 15,963 views | Discuss this16 years ago -
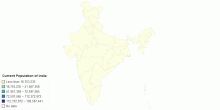
Population
Current Population of India
hhahahaha3.67 rating | 3,261 views | Discuss this15 years ago