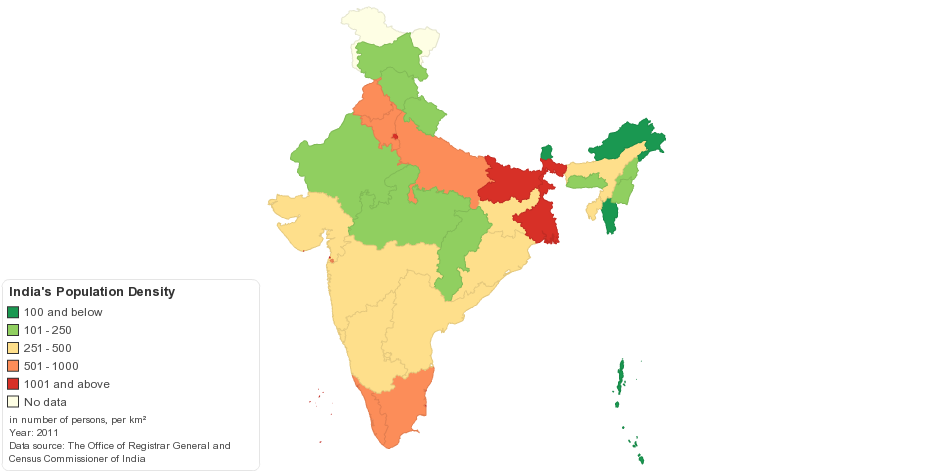
This map shows India's population density in 2011 census.
India's Population Density:382 persons per sq. km. (2011)
India's Population Density: 325 persons per sq. km. (2001)
15 years ago
| India/State/ Union Territory # | Density (Per sq. km.) – 1991 | Density (Per sq. km) – 2001 | Density (Per sq. km.) – 2011 |
|---|---|---|---|
| Andaman & Nicobar Islands # | 34 | 43 | 46 |
| Andhra Pradesh | 242 | 277 | 308 |
| Arunachal Pradesh | 11 | 14 | 17 |
| Assam | 285 | 340 | 397 |
| Bihar | 685 | 881 | 1,102 |
| Chandigarh # | 5,632 | 7,901 | 9,252 |
| Chhattisgarh | 130 | 154 | 189 |
| Dadra & Nagar Haveli # | 281 | 449 | 698 |
| Daman & Diu # | 911 | 1,413 | 2,169 |
| Goa | 316 | 364 | 394 |
| Gujarat | 211 | 258 | 308 |
| Haryana | 372 | 478 | 573 |
| Himachal Pradesh | 93 | 109 | 123 |
| Jammu & Kashmir | 77 | 100 | 124 |
| Jharkhand | 274 | 338 | 414 |
| Karnataka | 235 | 276 | 319 |
| Kerala | 749 | 819 | 859 |
| Lakshadweep # | 1,624 | 1,895 | 2,013 |
| Madhya Pradesh | 158 | 196 | 236 |
| Maharashtra | 256 | 315 | 365 |
| Manipur | 82 | 97 | 122 |
| Meghalaya | 79 | 103 | 132 |
| Mizoram | 33 | 42 | 52 |
| Nagaland | 73 | 120 | 119 |
| NCT of Delhi # | 6,353 | 9,340 | 11,297 |
| Orissa | 203 | 236 | 269 |
| Puducherry # | 1,687 | 2,034 | 2,598 |
| Punjab | 403 | 484 | 550 |
| Rajasthan | 129 | 166 | 201 |
| Sikkim | 57 | 77 | 86 |
| Tamil Nadu | 430 | 480 | 555 |
| Tripura | 263 | 305 | 350 |
| Uttar Pradesh | 548 | 690 | 828 |
| Uttarakhand | 132 | 159 | 189 |
| West Bengal | 767 | 903 | 1,029 |
