-
Health
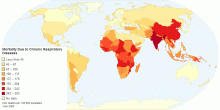
Mortality Due to Chronic Respiratory Diseases
The above map shows the age-standardized estimate of mortality by Chronic respiratory diseases per 100,000 people. Chronic respiratory diseases are chronic dise ...4.47 rating | 40,750 views | 1 Comment15 years ago -
Economic
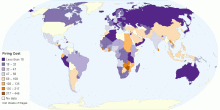
Firing Cost (Weeks of Wages)
This map shows firing cost, which is the cost of advanced notice requirements, severance payments, and penalties due when terminating a redundant worker, express ...4.33 rating | 53,777 views | Discuss this15 years ago -
Economic
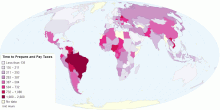
Time to Prepare and Pay Taxes (Hours)
This map indicates the time, in hours per year, it takes to prepare, file, and pay (or withhold) three major types of taxes: the corporate income tax, the value ...4.61 rating | 43,076 views | Discuss this15 years ago -
Economic
Ease of Doing Business - Rank
Thia map shows ease of doing business index, which ranks economies from 1 to 183, with first place being the best. A high ranking means that the regulatory envir ...4.61 rating | 60,426 views | Discuss this15 years ago -
Society
The Worldwide Governance Indicators (WGI) project - 2010
The Worldwide Governance Indicators (WGI) project reports aggregate and individual governance indicators for 213 economies, for six dimensions of governance: ...4.21 rating | 36,662 views | 2 Comments15 years ago -
Population
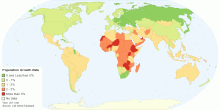
Current World Population Growth Rate
This map shows current world population growth rate. Current World Population Growth Rate: 1.092% (2011 est.) Population growth is the change in a population o ...4.29 rating | 32,099 views | Discuss this15 years ago -
Health
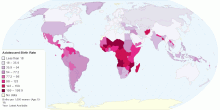
Adolescent Birth Rate
This map shows adolescent birth rate, that measures the annual number of births to women 15 to 19 years of age per 1,000 women in that age group. It represents t ...4.55 rating | 35,186 views | 3 Comments15 years ago -
People
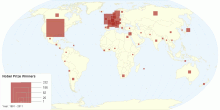
Nobel Prize Winners by Country
This map shows the total number of winners of the Nobel Prize and the Prize in Economic Sciences. The Nobel Prizes and the Prize in Economic Sciences has been aw ...4.27 rating | 29,990 views | Discuss this15 years ago -
People
World Marriage Data
This group of interactive maps provides a comparable information on the marital status of the population, as well as the number of marriages and divorces for all ...3.54 rating | 77,182 views | 4 Comments15 years ago -
People
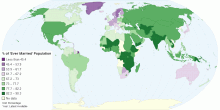
'Ever Married' Women and Men
This map shows percentage of people that are 'Ever Married' in a particular year, either latest available or one that has the complete data. 'Ever m ...4.60 rating | 13,515 views | Discuss this15 years ago -
People
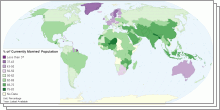
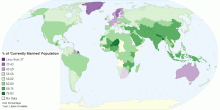
'Currently Married' Women and Men
This map shows percentage of people that are 'Currently Married' in a particular year, either latest available or one that has the complete data. 'C ...3.90 rating | 53,700 views | Discuss this15 years ago -
People
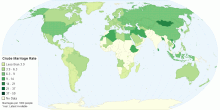
Crude Marriage Rate
This map shows crude marriage rate, that is the annual number of marriages per 1,000 population.4.16 rating | 20,594 views | Discuss this15 years ago -
People
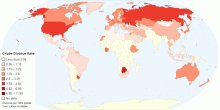
Crude Divorce Rate
This map shows crude divorce rate, that is the annual number of divorces per 1,000 population.4.13 rating | 28,994 views | Discuss this15 years ago -
People
Singulate Mean Age at Marriage
This map shows singulate mean age at marriage (SMAM), that is the average length of single life expressed in years among those who marry before age 50.5.00 rating | 13,893 views | Discuss this15 years ago -
People
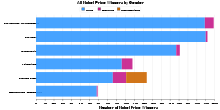
All Nobel Prize Winners by Gender
This chart shows All the Nobel Prizes and the Prize in Economic Sciences ranked by gender. The Nobel Prizes and the Prize in Economic Sciences has been awarded 8 ...4.59 rating | 45,638 views | 3 Comments15 years ago