-
Others
Happy Valentines Day in Different Languages
Happy Valentines Day! Saint Valentine's Day, commonly shortened to Valentine's Day, is an annual commemoration held on February 14 celebrating love and affection ...3.61 rating | 77,595 views | 23 Comments11 years ago -
Energy
Historical Crude Oil prices, 1861 to Present
This chart shows the historical Crude Oil prices in US dollars per barrel - 1861 onwards. Note: 1861-1944 US Average. 1945-1983 Arabian Light posted at ...4.25 rating | 509,294 views | 9 Comments11 years ago -
Food & Agriculture
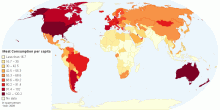
Current Worldwide Annual Meat Consumption per capita
This map shows current worldwide annual Meat Consumption per capita. World average meat consumption: 41.90 kg per person per year4.54 rating | 735,405 views | 46 Comments13 years ago -
Food & Agriculture
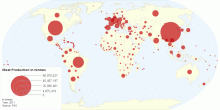
Current Worldwide Annual Meat Production in tonnes ...
This map shows current worldwide annual Meat Production in tonnes per country. World average meat production: 727,052,012 tonnes per year.4.56 rating | 23,495 views | Discuss this13 years ago -
Health
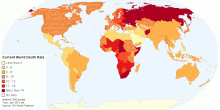
Current World Death Rate
This map shows current annual number of deaths during a year per 1,000 population at midyear; also known as crude death rate. Current World Death Rate: 7.9 deat ...3.93 rating | 45,884 views | 1 Comment14 years ago -
Economic
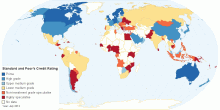
Standard & Poor's Credit Rating for each country
This map shows Standard & Poor's Credit Rating for each country. Estonia's credit rating was raised by Standard & Poor's Ratings to the se ...4.46 rating | 790,747 views | 31 Comments14 years ago -
Economic
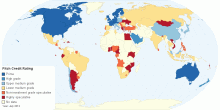
Fitch Credit Rating for each country
This map shows Fitch credit rating for each country. Fitch Ratings is a global rating agency dedicated to providing value beyond the rating through independent ...4.21 rating | 384,335 views | 8 Comments14 years ago -
Economic
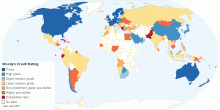
Moody's Credit Rating for each country
This map shows Moody's credit rating for each country. Moody's Analytics and Moody's Investors Service, is a credit rating agency which performs int ...4.40 rating | 599,465 views | 13 Comments14 years ago -
Population
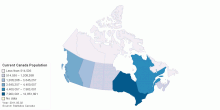
Current Canada Population
This map shows current Canada population by provinces and territories.3.80 rating | 8,162 views | Discuss this14 years ago -
Social
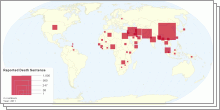
Death Sentences and Executions 2011
This maps shows death sentence and executions in 2011.4.17 rating | 423,251 views | 5 Comments14 years ago -
Social
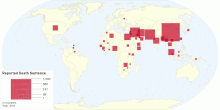
Reported Death Sentence
This map shows number of death sentence given in 2011.4.48 rating | 521,909 views | 1 Comment14 years ago -
Social
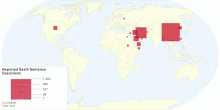
Reported Death Sentence Executions
This map shows death sentence executions in 2011.5.00 rating | 19,570 views | Discuss this14 years ago -
Economic
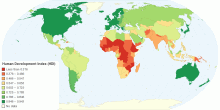
Human Development Index (HDI)
This map shows Human Development Index (HDI) for 169 countries in the World. Update for 2011 What is Human Development Index? The Human Development Index (HDI ...4.00 rating | 202,414 views | 16 Comments14 years ago -
Energy
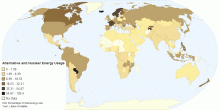
Alternative and Nuclear Energy (Percentage of Total ...
This map shows clean energy, expressed as a percentage of total energy use. Clean energy is noncarbohydrate energy that does not produce carbon dioxide whe ...4.02 rating | 46,061 views | 7 Comments15 years ago -
Health
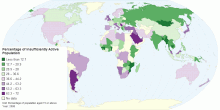
Percentage of Insufficiently Active Population
This map shows percentage of defined population(aged 15 or above; age-standardized estimate) attaining less than 5 times 30 minutes of moderate activity per week ...4.40 rating | 437,572 views | 2 Comments15 years ago