-
Environment
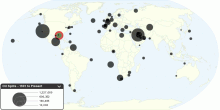
The Largest Oil Spills in History, 1901 to Present
This map shows the largest oil spills in history (1901 to Present), from tanker accidents and drilling operations, as well as a number of other notable spills. A ...4.22 rating | 234,923 views | 6 Comments16 years ago -
Food & Agriculture
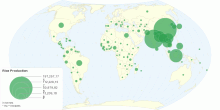
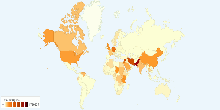
Worldwide Rice Production
This map shows global rice production. Worldwide Rice Production : 678,688,289 tonnes Worldwide Rice Area Harvested : 161,420,743 Ha World production of rice ...4.19 rating | 65,339 views | 6 Comments15 years ago -
Health
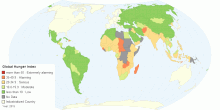
Global Hunger Index
This map shows Global Hunger Index (GHI) for 128 developing countries. The Global Hunger Index (GHI) is a tool adapted and further developed by the Internationa ...3.91 rating | 92,208 views | 5 Comments10 years ago -
Social
Number of Cinema Admissions per Person by Country, ...
This chart shows number of cinema admissions per person in each country. Number of cinema admissions in the major countries: ~1.45 visits per person3.85 rating | 29,638 views | 4 Comments17 years ago -
Environment
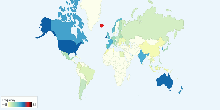
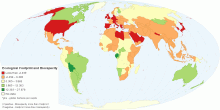
Ecological Footprint of Consumption Compared to Biocapacity
This map compares each country's total consumption Footprint with the biocapacity available within its own borders. Many countries rely, in net terms, on th ...4.14 rating | 88,296 views | 4 Comments15 years ago -
Health
Current World People Living with HIV/AIDS
This chart shows current world people living with HIV/AIDS. Current World People Living with HIV/AIDS: 33 million3.42 rating | 18,978 views | 3 Comments17 years ago -
Environment
Threatened species of Animals in each Country
This chart shows threatened species of animals in each Red List category in each country. Red List includes Critically Endangered, Endangered and Vulnerable spec ...3.73 rating | 22,228 views | 3 Comments17 years ago -
Country Info
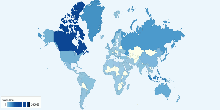
Length of Coastline by Country
This map shows length of coastline in each country. The total length of coastline in the world: 356,000 km This entry gives the total length of the boundary be ...3.86 rating | 132,698 views | 3 Comments16 years ago -
Immigration
Total Refugees by Country of Asylum (Received)
This map shows total refugees (received) by country of asylum or residence. Total refugees in the world: 10,478,621 Refugees leave their country because they h ...4.35 rating | 26,075 views | 2 Comments16 years ago -
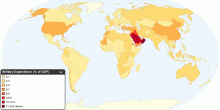
Economic
Current Worldwide Military Expenditure as a percent ...
This map shows public expenditure in a given financial year on military as a percentage of gross domestic product (GDP). Current world military expenditure: roug ...4.32 rating | 30,281 views | 2 Comments16 years ago -
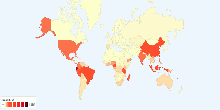
Health
Worldwide Malaria Deaths
This map shows worldwide malaria deaths, 1990 - 2009. Worldwide malaria deaths: 117,704 (Year: 2009) Today (April 25) is World Malaria Day. What is Malaria? ...4.37 rating | 230,985 views | 2 Comments15 years ago -
Environment
Threatened Species of Plants in each Country
This chart shows threatened species of plants in each Red List category in each country. Number of threatened species of plants in 2008: 10962 Current Number o ...4.14 rating | 11,798 views | 1 Comment17 years ago -
Social
Number of Cinema Screens by Country
This chart shows number of cinema screens in each country. Cinema screens include Indoor screens and Drive-in screens. Number of cinema screens in the maj ...3.69 rating | 83,801 views | 1 Comment17 years ago -
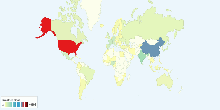
Economic
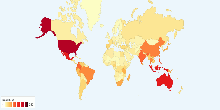
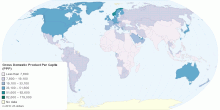
Current Worldwide Gross Domestic Product Per Capita ...
This entry shows Gross Domestic Product (GDP) on a purchasing power parity (PPP) basis divided by population as of 1 July for the same year. World Gross Domesti ...4.35 rating | 10,729 views | 1 Comment15 years ago -
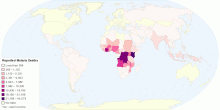
Work
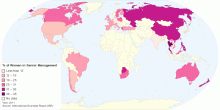
Proportion of Women in Senior Management - 2011
This map shows proportion of Women in Senior Management (2011). Global average: 20% of Women in Senior Management Research from the 2011 Grant Thornton Inter ...4.76 rating | 20,414 views | 1 Comment15 years ago