-
People
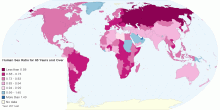
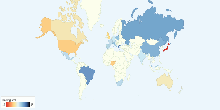
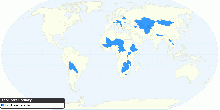
Worldwide Human Sex Ratio for 65 Years and Over
This map shows worldwide human sex ratio for 65 years and over. Sex ratio is the number of males for each female. Current world sex ratio for 65 years and over: ...3.80 rating | 22,886 views | Discuss this14 years ago -
People
World Literacy by Country
This chart shows current world literacy. Current World Literacy: 82% of total population3.88 rating | 13,021 views | Discuss this16 years ago -
Country Info
Flags of Every Country
This map shows Flags of every country in the world. Flag description produced from actual flags or the best information available at the time the entry was writ ...4.61 rating | 1,372,488 views | 151 Comments14 years ago -
Food & Agriculture
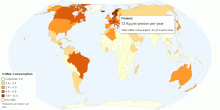
Current Worldwide Annual Coffee Consumption per capita
This map shows Coffee consumption in kilograms, consumed annually by each person in a given country or region. Current World Total Coffee Consumption: 1.3 Kilogr ...4.51 rating | 830,696 views | 26 Comments15 years ago -
Social
Percentage of People Having Sex Weekly by Country
This chart shows worldwide percentage of people having sex weekly. Average frequency of having sex among 26 countries: 67%4.08 rating | 696,915 views | 14 Comments16 years ago -
Social
Satisfaction in Having Sex by Country
This chart shows satisfaction in having sex by country. Average satisfaction in having sex among 26 countries: 43%3.80 rating | 474,161 views | 16 Comments16 years ago -
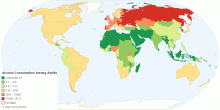
Drugs & Crime
Current Worldwide Alcohol Consumption Among Adults
This chart shows alcohol consumption among adults aged ≥ 15 years in litres per person per year. Current worldwide alcohol consumption among adults: 6.13 lit ...4.48 rating | 236,066 views | 3 Comments14 years ago -
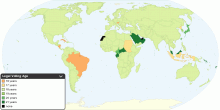
Country Info
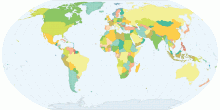
Legal Voting Age around the World
This map shows legal voting age around the world. A voting age is a minimum age established by law that a person must attain to be eligible to vote in a public e ...4.27 rating | 186,621 views | 19 Comments16 years ago -
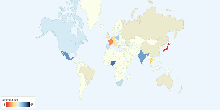
Country Info
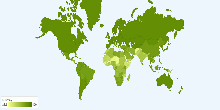
Landlocked country
This map shows worldwide Landlocked country. Number of Landlocked country: 444.56 rating | 89,765 views | 5 Comments16 years ago -
Tourism
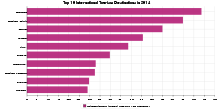
Top 10 Most Visited Countries by Tourists in 2014
Out of a global total of 1.133 billion tourists, the top ten international tourism destinations in 2014 are shown in the above chart. Note: Images are for refer ...4.51 rating | 67,369 views | Discuss this10 years ago -
Country Info
Countries That Border Only One Other Country
This map shows list of sovereign countries that border only one other country, with only land borders being counted.4.29 rating | 62,102 views | 3 Comments14 years ago -
Country Info
Top 10 Longest Rivers
This chart shows top 10 longest river on Earth. The length of a river is very hard to calculate, the source, the identification of the mouth, and the scale of m ...3.96 rating | 56,822 views | 6 Comments15 years ago -
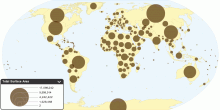
Environment
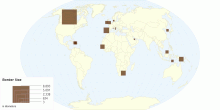
Total Surface Area by Country
This map shows Total surface area by country. Total surface area of world: 510,072,000 sq km Total area is the sum of all land and water areas delimited by inter ...3.81 rating | 46,985 views | 3 Comments15 years ago -
Health
Current World Birth Rate
This chart shows current world birth rate. Current World Birth Rate: 19.95 births/1,000 people This entry gives the average annual number of births during a ye ...3.59 rating | 45,901 views | 5 Comments16 years ago -
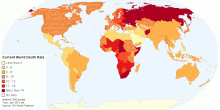
Health
Current World Death Rate
This map shows current annual number of deaths during a year per 1,000 population at midyear; also known as crude death rate. Current World Death Rate: 7.9 deat ...3.97 rating | 40,400 views | 1 Comment13 years ago