-
Country Info
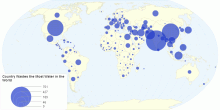
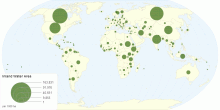
Country Wastes the Most Water in the World
This map shows total water withdrawal for agricultural, industrial and municipal purposes by country. Water withdrawal is the quantity of water removed from avai ...2.77 rating | 4,599 views | Discuss this11 years ago -
Food & Agriculture
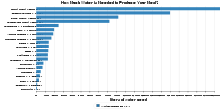
How Much Water is Needed to Produce Your Meal?
UN-Water World Water Day 2012: Water and Food Security4.62 rating | 8,595 views | 2 Comments14 years ago -
Environment
Water Usage Per Person Per Day in Liter
A map, showing waterusage per person, per day in liter.4.33 rating | 22,951 views | 6 Comments12 years ago -
Country Info
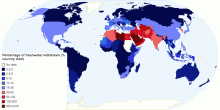
Percentage of freshwater withdrawn
Proportion of total actual renewable freshwater resources withdrawn as a % of country reserve Aquastat - MDG Water Indicator (around 2006) - most up-to-date dat ...5.00 rating | 3,110 views | Discuss this12 years ago -
Food & Agriculture
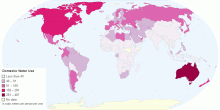
Domestic Water Use by Country
This chart shows Domestic Water Use by Country. Domestic water use is water used for indoor and outdoor household purposes— all the things you do at home ...3.81 rating | 18,960 views | Discuss this8 years ago -
Environment
Inland Water Area by Country
This chart shows inland water area details by country. Inland waters are permanent water bodies inland from the coastal zone and areas whose properties and use ...4.27 rating | 9,479 views | Discuss this10 years ago -
Environment
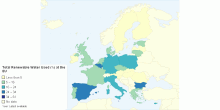
Total Renewable Water Used at the EU
This percentage indicates the total freshwater withdrawn by a country relating to the actual total renewable water resources. The total renewable water resources ...4.11 rating | 7,377 views | Discuss this13 years ago -
Health
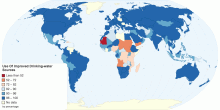
Population Using Improved Drinking-water Sources by Country
This map shows Population Using Improved Drinking-water Sources by Country. Drinking water is water safe enough to be consumed by humans or used with low r ...3.22 rating | 11,508 views | Discuss this10 years ago -
Health
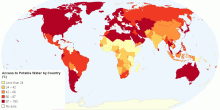
Access to Potable Water by Country
Analysis of countries of the world and their population's access level to clean drinking water.4.27 rating | 6,962 views | 11 Comments11 years ago -
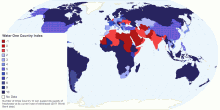
Country Info
Water: One Country Index
World Bank data (2011) Reserve: Renewable internal freshwater resources (billion cubic meters) World Bank Withdrawal: Annual Freshwater Withdra ...3.29 rating | 4,783 views | Discuss this12 years ago -
Environment
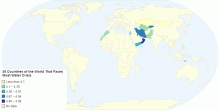
36 Countries of the World That Faces Most Water Crisis
This map shows 37 percent of the total countries in the world experience extremely high baseline water scarcity. This means, according to this research, more tha ...2.33 rating | 2,764 views | Discuss this10 years ago -
Environment
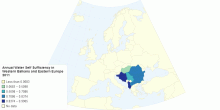
Annual Water Self Sufficiency in Western Balkans an ...
Annual freshwater withdrawals (total water withdrawals, not counting evaporation losses from storage basins, including water from desalination plants)/Renewable ...1.00 rating | 3,249 views | Discuss this12 years ago -
Environment
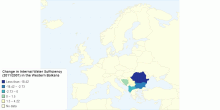
Change in Internal Water Sufficiency (2011/2007) in ...
Indicator of change in Internal Water use in comparison with internal water availability (2011/2007) in the Western Balkans0.00 rating | 3,415 views | Discuss this12 years ago -
Country Info
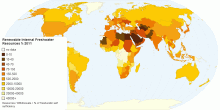
Renewable Internal Freshwater Resources 2011
Reserve / Withdrawal World Bank5.00 rating | 3,904 views | Discuss this11 years ago -
Country Info
Annual Freshwater Withdrawals Total Billion Cubic M ...
World Bank 1997, Annual Freshwater Withdrawals5.00 rating | 3,457 views | Discuss this11 years ago