-
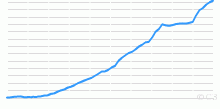
Population
Historical Population of Andorra, 1947 to Present
This chart shows the historical population statistics of Andorra - 1947 onwards.4.33 rating | 18,651 views | 1 Comment17 years ago -
Population
Historical Population of World, 1 AD to Future
This chart shows the historical population statistics of World - 1 AD onwards.3.83 rating | 68,856 views | 5 Comments17 years ago -
Population
Historical Population of United States, 1790 to Present
This chart shows the historical population statistics of United States - 1790 onwards.3.89 rating | 86,617 views | 2 Comments17 years ago -
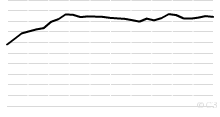
Population
Historical Population of Australia, 1788 to Future
This chart shows the historical population statistics of Australia - 1788 onwards. Current population of Australia is: 22,065,671 Persons. Estimated resident pop ...3.46 rating | 212,986 views | 13 Comments16 years ago -
Population
Historical Population of United Kingdom, 43 AD to Present
This chart shows the historical population statistics of United Kingdom - 43 AD onwards.3.78 rating | 193,914 views | 11 Comments17 years ago -
People
Historical Population of Aboriginal and Torres Stra ...
This chart shows the historical population of Aboriginal and Torres Strait Islander Australians, 1986 onwards. Current population of Aboriginal and Torres Strait ...5.00 rating | 8,764 views | Discuss this17 years ago -
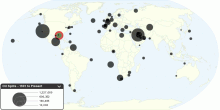
Environment
The Largest Oil Spills in History, 1901 to Present
This map shows the largest oil spills in history (1901 to Present), from tanker accidents and drilling operations, as well as a number of other notable spills. A ...4.22 rating | 234,970 views | 6 Comments16 years ago -
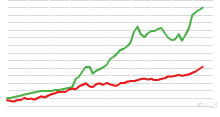
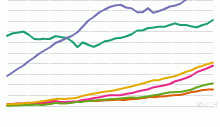
Economic
World Bicycle and Automobile Production, 1950 to Present
This chart shows World Bicycle and Automobile Production, 1950 to 2007. Note: Bicycle data include electric bicycles. 2003 bicycle data considered underestimate ...4.76 rating | 54,193 views | Discuss this16 years ago -
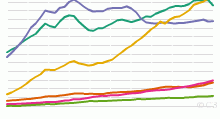
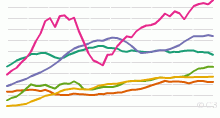
Energy
Historical Oil Consumption by Region, 1965 to Present
This chart shows the historical Oil Consumption in barrels per day - 1965 onwards. List of countries included in each region: North America includes United ...4.07 rating | 46,979 views | 2 Comments17 years ago -
Energy
Historical Oil Production by Region, 1965 to Present
This chart shows the historical Oil Production - 1965 onwards. List of countries included in each region: North America includes United States,Canada and Me ...4.41 rating | 45,658 views | 5 Comments17 years ago -
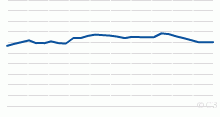
Energy
Historical World Reserves-to-production ratio of Oi ...
This chart shows the Historical World Reserves-to-production ratio of Oil - 1980 onwards. Current World Reserves-to-production ratio of Oil: 42.11 Years What D ...4.17 rating | 23,991 views | Discuss this17 years ago -
Energy
Historical Natural Gas Consumption by Region, 1965 ...
This chart shows the historical Natural Gas Consumption - 1965 onwards. List of countries included in each region: North America includes United States,Cana ...4.40 rating | 13,941 views | Discuss this17 years ago -
Energy
Historical Natural Gas Production by Region, 1970 t ...
This chart shows the historical Natural Gas Production - 1970 onwards. List of countries included in each region: North America includes United States,Canad ...4.11 rating | 13,090 views | Discuss this17 years ago -
Energy
Historical World Reserves-to-production ratio of Na ...
This chart shows the Historical World Reserves-to-production ratio of Natural Gas - 1980 onwards. Current World Reserves-to-production ratio of Natural Gas: 60. ...5.00 rating | 10,800 views | Discuss this17 years ago -
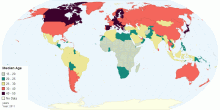
People
Global Median Age
This map shows the median age that divides a population into two numerically equal groups; that is, half the people are younger than this age and half are older. ...4.58 rating | 51,109 views | 2 Comments15 years ago