-
Food & Agriculture
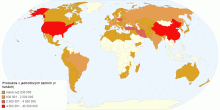
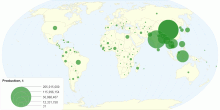
Světová produkce jablek 2018
Mapa zobrazující produkci jablek v roce 20180.00 rating | 1,853 views | Discuss this6 years ago -
Food & Agriculture
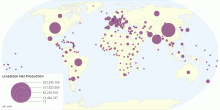
Livestock Net Production by Country
This chart shows livestock net production by country. Livestock are domesticated animals raised in an agricultural setting to produce commodities such as food, ...4.11 rating | 6,346 views | Discuss this11 years ago -
Country Info
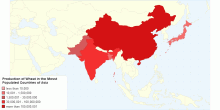
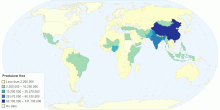
Production of Wheat in the Most Populated Countries of Asia
Production of wheat in the most populated countries of Asia0.00 rating | 2,435 views | Discuss this7 years ago -
Economic
Produccin De Berries En 2013
berries0.00 rating | 3,430 views | Discuss this11 years ago -
Food & Agriculture
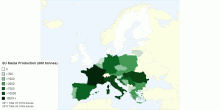
EU Maize Production (000 tonnes)
EU Maize Production (000 tonnes). Created by www.public-ledger.com from Coceral data. For a free trial to The Public Ledger - news, prices and analysis in ...5.00 rating | 3,153 views | Discuss this15 years ago -
Country Info
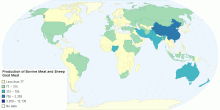
Production of Bovine Meat and Sheep Goat Meat
some description4.00 rating | 7,583 views | Discuss this15 years ago -
Food & Agriculture
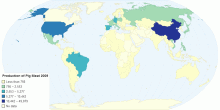
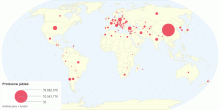
Production of Pig Meat, 2009
Production of Pig Meat in 2009. 1000 tonnes5.00 rating | 1,847 views | Discuss this14 years ago -
Country Info
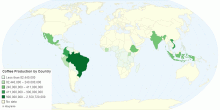
Coffee Production by Country
There are more than 50 countries involved in the world's coffee production, but more than half of it is grown in just three countries: Brazil, Vietnam and Co ...4.00 rating | 10,579 views | Discuss this13 years ago -
Country Info
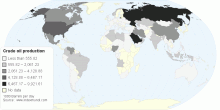
Crude Oil Production in the World 2012
Crude Oil Production in the World 20120.00 rating | 2,867 views | Discuss this13 years ago -
Country Info
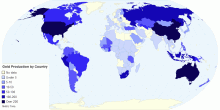
Gold Production by Country
Gold production by country0.00 rating | 3,129 views | Discuss this12 years ago -
Country Info
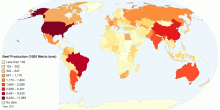
2011 Global Pattern of Beef Production
This map shows the 2011 global pattern of beef production. World beef production expressed in Metric tons: 66,359,000.00 Map made by Imogen Wallis-Mayer5.00 rating | 3,897 views | Discuss this12 years ago -
Food & Agriculture
Produkce koz
Produkce koz0.00 rating | 1,208 views | Discuss this12 years ago -
Food & Agriculture
World Rice Production 2013
World paddy rice production in 2013 according to FAOSTAT5.00 rating | 2,663 views | Discuss this11 years ago -
Country Info
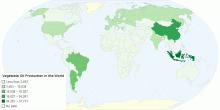
Vegetable Oil Production in the World
Vegetable Oil Production in the World5.00 rating | 1,729 views | Discuss this11 years ago -
Food & Agriculture
Produkce jablek
Největším producentem jablek je Čína.0.00 rating | 2,000 views | Discuss this11 years ago