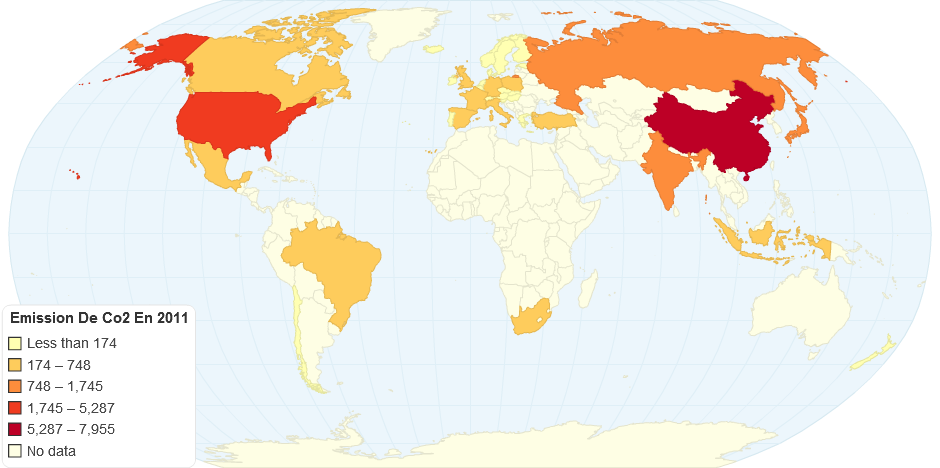
Emission De Co2 En 2011
Do you like this chart?
✔ Yes
✖
✚ Share
References and Data Table
HTML Embed code
$ Buy Now
1,412 views
- Add new comment

Map of Oil Spills
2.82 rating | 6,346 views | 0 comments
Grams CO2 per Km normalized to NEDC
5.00 rating | 6,428 views | 0 comments
World Pollution Data
3.00 rating | 3,961 views | 0 comments
Particulate Matter
5.00 rating | 3,471 views | 0 comments