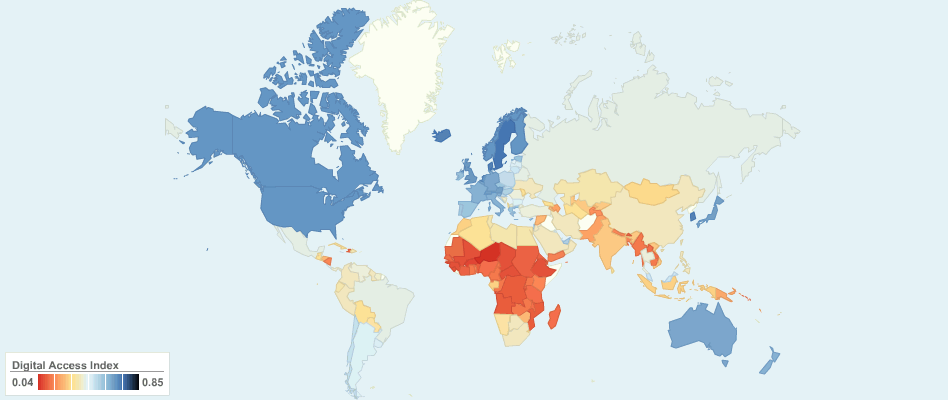
This map shows Digital Access Index (DAI) around the world.
Digital access allows individuals and communities to access information on changing weather patterns, current events, disasters and early warning systems, as well as general information on agriculture and markets to facilitate adaptation. Digital access is also important during all phases of disaster response. A high score on the Digital Access Index suggests reduced vulnerability and increased adaptive capacity to climate change.
What is Digital Access Index?
The Digital Access Index reflects the ability of each country's population to take advantage of internet communication technologies. It is a composite score of eight variables describing availability of infrastructure, affordability of access, educational level, quality of information and communication technology services, and Internet usage. The DAI has been calculated for 178 economies where European countries were among the highest ranked. The DAI allows countries to see how they compare to peers and their relative strengths and weaknesses. The DAI also provides a transparent and globally measurable way of tracking progress towards improving access to ICTs.
Digital Access Index is developed by the International Telecommunication Union.
How is the Digital Access Index calculated?
The Digital Access Index is calculated as a weighted average of 8 variables in 5 categories. The variables, listed below, measure access to and usage of ICTs as well as education level of the population. Each variable is converted to an indicator with a value between zero and one by dividing it by the maximum value or "goalpost". Each indicator is then weighted within its category and the resulting category index values are averaged to obtain the overall DAI value.
Each category is of equal importance, although some variables within vategories are assigned unequal weights. See below:
- Infrastructure
- Fixed telephone subscribers per 100 inhabitants 10%
- Mobile cellular subscribers per 100 inhabitants 10%
- Affordability
- Internet access price as percent of GNI x 100 20%
- Knowledge
- Adult Literacy 13%
- Combined primary, secondary, and teritary school enrollment 7%
- Quality
- International Internet bandwith per capita 10%
- Broadband subscribers per 1000 inhabitants 10%
- Usage
- Internet users per 100 inhabitants 20%
For more information, please follow the reference link below.
16 years ago

