-
Environment
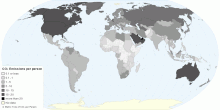
Current Worldwide Carbon Dioxide Emissions per Person
This map shows current worldwide carbon dioxide(CO₂) emissions per person from the consumption of energy. Data includes emissions due to the consumption of pet ...4.79 rating | 38,670 views | Discuss this15 years ago -
Environment
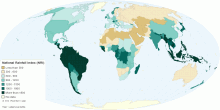
National Rainfall Index (NRI)
This map shows national rainfall index (NRI). Waht is National Rainfall Index (NRI)? A national rainfall index (NRI) is defined as the national average of the ...4.62 rating | 38,483 views | Discuss this15 years ago -
Environment
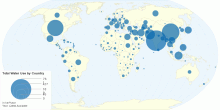
Total Water Use by Country
This map shows total water withdrawal for agricultural, industrial and municipal purposes by country. Water withdrawal is the quantity of water removed from avai ...3.97 rating | 38,416 views | Discuss this15 years ago -
Environment
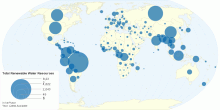
Total Renewable Water Resources by Country
This map shows total renewable water resources by country. It corresponds to the maximum theoretical yearly amount of water actually available for a country at a ...4.29 rating | 37,753 views | 4 Comments15 years ago -
Environment
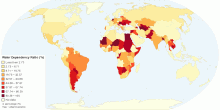
Total Renewable Water Resources Dependency Ratio by Country
This map shows the percent of total renewable water resources dependency ratio or originating outside the country. What is Dependency ratio? Dependency ratio m ...4.81 rating | 34,581 views | 2 Comments15 years ago -
Environment
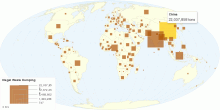
Global Illegal Waste Dumping by Country
This map shows an estimate of illegal waste dumping (in forests, public areas and elsewhere) lying around in the world by country (in tons). Total World illegal ...4.72 rating | 34,013 views | 5 Comments15 years ago -
Environment
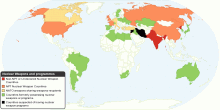
Nuclear Weapons and Programmes Around the World
This map shows current nuclear weapons or programmes around the world. There are currently nine states that have successfully detonated nuclear weapons. Five are ...4.09 rating | 30,634 views | 8 Comments16 years ago -
Environment
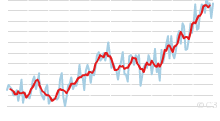
Historical Global Land-Ocean Temperatures, 1880 to Present
The time series shows the combined global land and ocean surface temperature record from 1880 to present, with the base period 1951-1980. How data were collecte ...3.97 rating | 29,293 views | 3 Comments17 years ago -
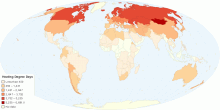
Environment
Worldwide Heating Needs
This map shows worldwide heating degree days. Heating degree day (HDD) is a measurement designed to reflect the demand for energy needed to heat a home or busine ...4.30 rating | 25,566 views | 2 Comments15 years ago -
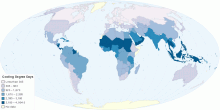
Environment
Worldwide Cooling Needs
This map shows worldwide cooling degree days. Cooling degree day (HDD) is a measurement designed to reflect the demand for energy needed to cool a home or busine ...4.64 rating | 22,660 views | 2 Comments15 years ago -
Environment
Threatened species of Animals in each Country
This chart shows threatened species of animals in each Red List category in each country. Red List includes Critically Endangered, Endangered and Vulnerable spec ...3.73 rating | 22,317 views | 3 Comments17 years ago -
Environment
Threatened Species of Plants in each Country
This chart shows threatened species of plants in each Red List category in each country. Number of threatened species of plants in 2008: 10962 Current Number o ...4.14 rating | 11,853 views | 1 Comment17 years ago -
Environment
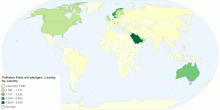
Pakistan flood aid pledged, country by country
Floods have decimated Pakistan: the number of people suffering could exceed the combined total of the 2004 Indian Ocean tsunami, the 2005 Kashmir earthquake and ...3.00 rating | 9,801 views | Discuss this16 years ago -
Environment
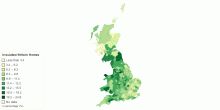
How Many British Homes Have Been Insulated by the G ...
This interactive map shows percentage of British homes have been insulated by the Government's Carbon Emissions Reduction Target (CERT). Over 2.6m homes acr ...3.40 rating | 7,565 views | 1 Comment15 years ago -
Environment
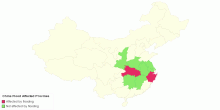
China Flood Affected Provines
This map shows flood affected area5.00 rating | 5,215 views | Discuss this15 years ago