-
Health
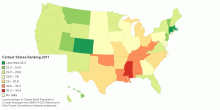
United States of Obesity: Fattest States Ranking - 2011
This map shows United States of obesity: 2011 Fattest States Ranking. The rankings use a three-year average in order to smooth out statistical fluctuations. For ...4.19 rating | 186,588 views | 15 Comments15 years ago -
Health
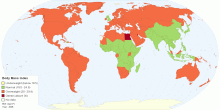
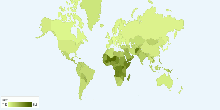
Body Mass Index (BMI) by Country
This map shows World trends in age-standardized mean Body Mass Index (BMI) 199 countries over 28 years. The worldwide prevalence of obesity has nearly doubled s ...4.12 rating | 200,743 views | 11 Comments15 years ago -
Health
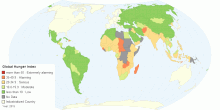
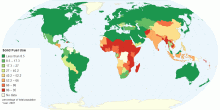
Global Hunger Index
This map shows Global Hunger Index (GHI) for 128 developing countries. The Global Hunger Index (GHI) is a tool adapted and further developed by the Internationa ...3.91 rating | 92,629 views | 5 Comments10 years ago -
Health
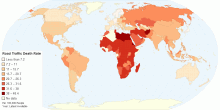
Estimated Road Traffic Fatal Injury Death Rate (Per ...
This chart shows the estimated number of road traffic deaths, per 100,000 population per year. WHO estimates about 1.2 million people die each year on the world ...4.55 rating | 53,395 views | 5 Comments15 years ago -
Health
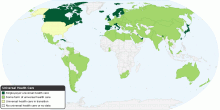
Universal Health Care around the World
This map shows Universal health care around the world. Universal health care is a national health insurance program in many countries that is mostly financed by ...4.36 rating | 75,119 views | 5 Comments16 years ago -
Health
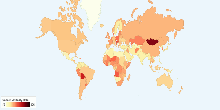
Current World Birth Rate
This chart shows current world birth rate. Current World Birth Rate: 19.95 births/1,000 people This entry gives the average annual number of births during a ye ...3.59 rating | 46,917 views | 5 Comments17 years ago -
Health
Household Solid Fuel Use
This Map shows the percentage of the total population that burn solid fuels in their households, primarily for cooking fuel. Solid fuels include coal or biomass ...4.63 rating | 23,024 views | 4 Comments15 years ago -
Health
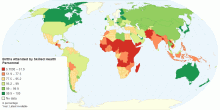
Percentage of Births Attended by Skilled Health Personnel
This map shows percentage of deliveries attended by health personnel(doctors, nurses or midwives) trained in providing life saving obstetric care, including givi ...4.31 rating | 18,816 views | 4 Comments15 years ago -
Health
Current Worldwide Cancer Mortality Rate
This chart shows current worldwide Cancer Age-standardized Mortality Rate. Cancer is a leading cause of death worldwide: it accounted for 7.4 million deaths (aro ...4.21 rating | 30,712 views | 4 Comments17 years ago -
Health
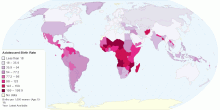
Adolescent Birth Rate
This map shows adolescent birth rate, that measures the annual number of births to women 15 to 19 years of age per 1,000 women in that age group. It represents t ...4.55 rating | 35,321 views | 3 Comments15 years ago -
Health
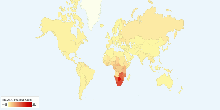
Current World HIV/AIDS Adult Prevalence Rate
This chart shows current world HIV/AIDS adult prevalence rate. Current World HIV/AIDS Adult Prevalence Rate: 0.8% (an estimate of the percentage of adults (aged ...4.31 rating | 16,315 views | 3 Comments17 years ago -
Health
Current World People Living with HIV/AIDS
This chart shows current world people living with HIV/AIDS. Current World People Living with HIV/AIDS: 33 million3.42 rating | 19,041 views | 3 Comments17 years ago -
Health
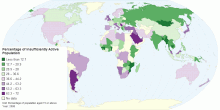
Percentage of Insufficiently Active Population
This map shows percentage of defined population(aged 15 or above; age-standardized estimate) attaining less than 5 times 30 minutes of moderate activity per week ...4.40 rating | 437,628 views | 2 Comments15 years ago -
Health
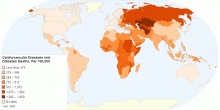
Mortality due to Cardiovascular Diseases and Diabetes
The above map shows the age-standardized estimate of mortality by Cardiovascular diseases and diabetes per 100,000 people. Heart disease or cardiovascular disea ...4.68 rating | 21,910 views | 2 Comments15 years ago -
Health
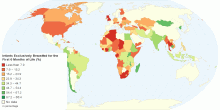
Percentage of Infants Exclusively Breastfed for the ...
This map shows percentage of Infants that are exclusively breastfed for the first six months of life. The World Health Organization (WHO) and the American Acade ...4.72 rating | 23,047 views | 2 Comments15 years ago