-
Education
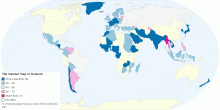
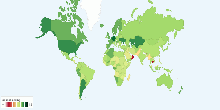
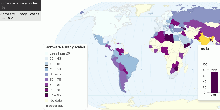
Percentage of Female Researchers within the Total R ...
This map shows percentage of female researchers as a share of the worldwide total researchers. Researchers are defined as professionals engaged in the conception ...4.53 rating | 16,896 views | 1 Comment15 years ago -
Economic
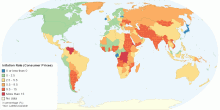
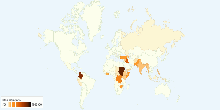
Current Inflation Rate (Consumer Prices) by Country
This map shows current Inflation Rate (consumer prices) by country. It is the annual percent change in consumer prices compared with the previous year's cons ...4.70 rating | 43,521 views | 1 Comment15 years ago -
Food & Agriculture
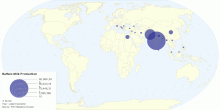
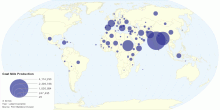
Current Worldwide Buffalo Milk Production
This map shows current worldwide Buffalo Milk (whole, fresh) production. World Total Buffalo Milk production: 92,140,146 tonnes per year4.20 rating | 24,499 views | 1 Comment15 years ago -
Food & Agriculture
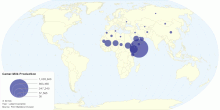
Current Worldwide Camel Milk Production
This map shows current worldwide Camel milk (whole, fresh) production. World Total Camel Milk Production: 1,840,201 tonnes per year4.50 rating | 18,242 views | 1 Comment15 years ago -
Education
Ending Age of Compulsory Education around the World
This chart shows ending age of compulsory education or legal school leaving age around the world. The ending age of compulsory education states the minimum age w ...3.74 rating | 34,071 views | Discuss this17 years ago -
Education
School Life Expectancy, Primary to Tertiary around ...
This chart shows school life expectancy (years), primary to tertiary education for female around the world. School life expectancy (SLE) is the total number of y ...4.56 rating | 9,668 views | Discuss this17 years ago -
Education
School Life Expectancy, Primary to Tertiary around ...
This chart shows school life expectancy (years), primary to tertiary education for male around the world. School life expectancy (SLE) is the total number of yea ...3.00 rating | 9,767 views | Discuss this17 years ago -
Immigration
Country of Destination of New Asylum-Seekers Applications
This map shows number of new asylum-seeker applications launched into the country. The number of new asylum-seeker applications launched: 827,323 An asylum-see ...4.07 rating | 19,461 views | Discuss this16 years ago -
Immigration
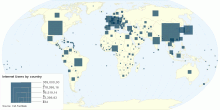
Internally Displaced Person by Country
This map shows internally displaced person by country. The number of internally displaced persons in the world: ~26,000,000 What is Internally Displaced Person ...4.40 rating | 17,266 views | Discuss this16 years ago -
Economic
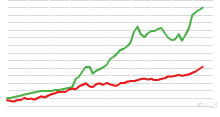
World Bicycle and Automobile Production, 1950 to Present
This chart shows World Bicycle and Automobile Production, 1950 to 2007. Note: Bicycle data include electric bicycles. 2003 bicycle data considered underestimate ...4.76 rating | 54,174 views | Discuss this16 years ago -
Economic
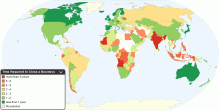
Time Required to Close a Business
This map shows time required to close a business around the world in days. This data identifies weaknesses in existing bankruptcy law and the main procedural an ...5.00 rating | 14,417 views | Discuss this16 years ago -
Information and Communication Technology
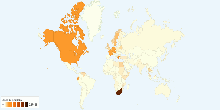
Number of Internet Users by country
This world map shows Number of Internet Users by Country. Current worldwide number of internet users: 1,832,779,793 (2009) Internet users are people with acces ...3.78 rating | 47,162 views | Discuss this15 years ago -
Economic
Global Software Piracy
This maps shows global software piracy. World Software Commercial Value of Unlicensed Software: US $51.4 billion in 2009 ($53 billion in 2008) World Software P ...4.38 rating | 25,369 views | Discuss this15 years ago -
Environment
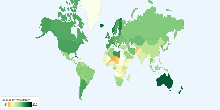
Total Renewable Water Resources per capita by Country
This map shows total renewable water resources per capita by country. Current world total renewable water resources: ~24,776 m³ (cu m)/inhabitant/year ( 24 ...4.36 rating | 114,270 views | Discuss this15 years ago -
Food & Agriculture
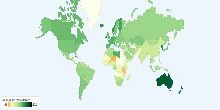
Current Worldwide Goat Milk Production
This map shows current worldwide Goat Milk (whole, fresh) production. World Total Goat Milk Production: 15,510,411 tonnes per year4.63 rating | 29,544 views | Discuss this15 years ago