-
Environment
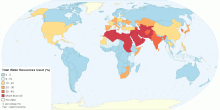
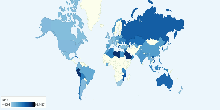
Proportion of Total Water Resources Used, percentage
This map shows worldwide surface water and ground water withdrawal as percentage of total renewable water resources. Water withdrawal is the quantity of water re ...4.63 rating | 37,443 views | Discuss this14 years ago -
Health
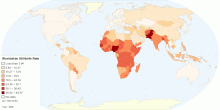
Current Worldwide Stillbirth Rate (per 1000 births)
This map shows Worldwide Stillbirth rate (per 1000 births). Stillbirth is the term used to describe the loss of a pregnancy or the birth of an infant that has di ...4.70 rating | 78,761 views | Discuss this14 years ago -
Others
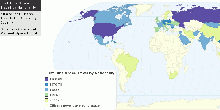
Space Travelers by Nationality
This map shows countries whose citizens have flown in space. Since the first human spaceflight by the Soviet Union (12 April 1961), citizens of 38 countries have ...3.95 rating | 16,342 views | 1 Comment14 years ago -
Food & Agriculture
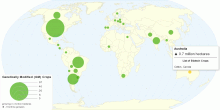
Global Distribution of Genetically Modified (GM) Crops
This map shows global distribution of Genetically Modified (GM) crops. Current World hectarage of biotech crops: 148.6 million hectares in 2010 World hectara ...4.37 rating | 75,737 views | 2 Comments14 years ago -
People
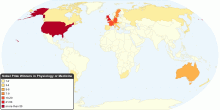
Nobel Prize Winners in Physiology or Medicine by Country
This chart shows current Nobel Prize Winners in Physiology or Medicine ranked by country. The Nobel Prize Winners in Physiology or Medicine has been awarded 196 ...4.38 rating | 22,251 views | Discuss this15 years ago -
Health
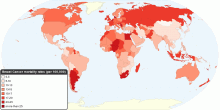
Current Worldwide Breast Cancer Mortality Rate
This map shows current worldwide Breast Cancer Age-standardised mortality rates. Breast cancer is by far the most frequent cancer among women with an estimated 1 ...4.57 rating | 38,641 views | 1 Comment15 years ago -
Drugs & Crime
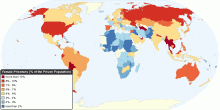
World Female Prisoners (percentage within the Priso ...
This map shows the percentage of female prisoners within each national prison population. Female prisoners includes women and girls held in penal institutions, a ...4.60 rating | 49,804 views | Discuss this15 years ago -
Economic
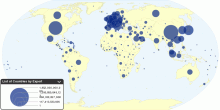
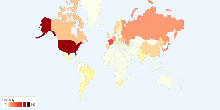
List of Countries by Exports
This map shows list of countries by exports. Exports means goods manufactured domestically that are bought by foreigners and sent to another county. The value re ...3.52 rating | 21,176 views | 2 Comments15 years ago -
Drugs & Crime
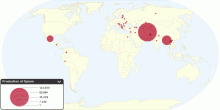
Current Worldwide Illicit Cultivation of Opium Popp ...
This chart shows current worldwide illicit cultivation of opium poppy and production of opium. Total area under opium poppy cultivation in the major culti ...4.19 rating | 183,356 views | Discuss this15 years ago -
Country Info
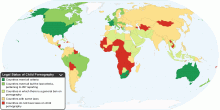
Legal Status of Child Pornography by Country
This map shows legal status of child pornography. Child pornography refers to images or films (also known as child abuse images) and in some cases writings depic ...4.04 rating | 1,056,341 views | 78 Comments15 years ago -
Social
Worldwide Distribution of Suicides Rates by Gender ...
This chart shows worldwide distribution of suicides rates by gender and age for year 2000. Suicide is among the three leading causes of death among those aged 15 ...4.08 rating | 47,615 views | 3 Comments15 years ago -
Energy
Current Nuclear Electricity Generation by Country
This chart shows current Nuclear Electricity Generation worldwide. Current Nuclear Electricity Generation: 2601 billion kWh from 436 nuclear power reactors Not ...4.60 rating | 16,193 views | 1 Comment16 years ago -
Energy
Current Worldwide Reserves-to-production ratio of N ...
This chart shows the Current Worldwide Reserves-to-production ratio of Natural Gas. Current World Reserves-to-production ratio of Natural Gas: 60.35 Years What ...4.13 rating | 14,311 views | 1 Comment16 years ago -
Energy
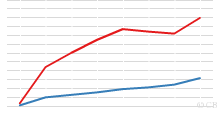
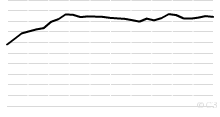
Historical World Reserves-to-production ratio of Oi ...
This chart shows the Historical World Reserves-to-production ratio of Oil - 1980 onwards. Current World Reserves-to-production ratio of Oil: 42.11 Years What D ...4.17 rating | 22,551 views | Discuss this16 years ago -
Energy
Historical Natural Gas Consumption by Region, 1965 ...
This chart shows the historical Natural Gas Consumption - 1965 onwards. List of countries included in each region: North America includes United States,Cana ...4.37 rating | 12,558 views | Discuss this16 years ago