-
Energy
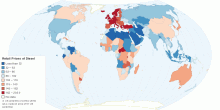
Worldwide Retail Prices of Diesel (US cents per litre)
This map shows worldwide retail prices of petroleum diesel (in US cents per litre) in more than 185 countries. Petroleum diesel, also called petrodiesel, or foss ...4.64 rating | 444,359 views | 10 Comments15 years ago -
Education
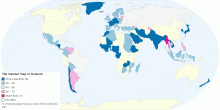
Percentage of Female Researchers within the Total R ...
This map shows percentage of female researchers as a share of the worldwide total researchers. Researchers are defined as professionals engaged in the conception ...4.53 rating | 16,323 views | 1 Comment15 years ago -
Infrastructure
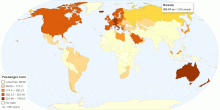
Worldwide Passenger Cars (per 1,000 people)
This map shows worldwide passenger cars, per 1000 people. Current world passenger cars: 131.64 per 1000 people What is passenger cars? Passenger cars refer to ...4.14 rating | 90,034 views | 11 Comments15 years ago -
Work
Over-the-Year (2009 - 2010) Change in Unemployment ...
This map shows over-the-Year (2009 - 2010) change in unemployment rates for United States. Unemployment Rates for United States: 9.6% unemployed (2010 annual av ...3.77 rating | 19,985 views | Discuss this15 years ago -
Economic
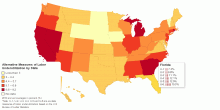
Alternative Measures of Labor Underutilization for ...
This map shows six alternative measures of labor underutilization for United States by state. United States, 2010 annual averages (percent): U-1: 5.7% U-2: ...3.67 rating | 6,803 views | Discuss this15 years ago -
Food & Agriculture
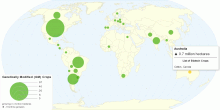
Global Distribution of Genetically Modified (GM) Crops
This map shows global distribution of Genetically Modified (GM) crops. Current World hectarage of biotech crops: 148.6 million hectares in 2010 World hectara ...4.37 rating | 76,867 views | 2 Comments15 years ago -
Drugs & Crime
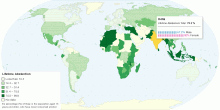
Worldwide Lifetime Alcohol Abstention
This map shows worldwide lifetime alcohol abstention, which is the opposite of alcohol consumption. Current world lifetime abstention: 45% (men: 35%; women:55%) ...4.28 rating | 36,950 views | 2 Comments15 years ago -
Food & Agriculture
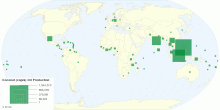
Worldwide Coconut (copra) Oil Production
This map shows worldwide coconut (copra) oil production in tonnes. Current world Coconut oil production: 3,734,208 tonnes What is Copra? Copra is dried sectio ...3.82 rating | 11,114 views | Discuss this15 years ago -
Environment
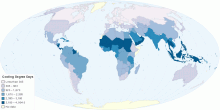
Worldwide Cooling Needs
This map shows worldwide cooling degree days. Cooling degree day (HDD) is a measurement designed to reflect the demand for energy needed to cool a home or busine ...4.64 rating | 22,128 views | 2 Comments15 years ago -
Environment
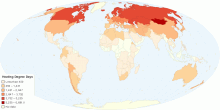
Worldwide Heating Needs
This map shows worldwide heating degree days. Heating degree day (HDD) is a measurement designed to reflect the demand for energy needed to heat a home or busine ...4.30 rating | 24,601 views | 2 Comments15 years ago -
Drugs & Crime
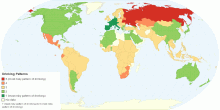
Worldwide Alcohol Drinking Patterns
This map shows worldwide alcohol drinking patterns. Alcohol drinking patterns is based on Patterns of Drinking Score. What is the Patterns of Drinking Score (PD ...4.33 rating | 33,558 views | 1 Comment15 years ago -
Drugs & Crime
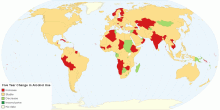
Five Year Change in Alcohol Use
This map shows five-year change (2001 - 2005) in recorded adult (15+) per capita alcohol consumption. The trend shows relatively stable global alcohol consumpti ...4.09 rating | 19,364 views | 1 Comment15 years ago -
Drugs & Crime
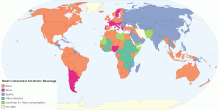
Most Consumed Alcoholic Beverage by Country
This map shows worldwide distribution of most consumed alcoholic (beer, wine, spirits or other alcoholic) beverages, in litres of pure alcohol. Key findings for ...4.53 rating | 760,783 views | 3 Comments15 years ago -
Drugs & Crime
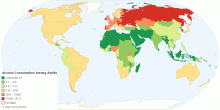
Current Worldwide Alcohol Consumption Among Adults
This chart shows alcohol consumption among adults aged ≥ 15 years in litres per person per year. Current worldwide alcohol consumption among adults: 6.13 lit ...4.48 rating | 237,500 views | 3 Comments15 years ago -
Economic
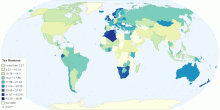
Total Tax Revenue as a Percentage of Gross Domestic ...
This map shows total tax revenue as a percentage of Gross Domestic Product (GDP). Current world average tax revenue: 15.97% of world GDP Tax revenue refers to ...4.56 rating | 34,293 views | 1 Comment15 years ago
