-
Energy
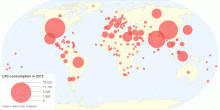
LPG gas Consumption by Households by Country
This chart shows consumption of Liquified Petroleum Gas by households in 2012. Liquified petroleum gas or liquid petroleum gas (LPG or LP gas), also referred to ...4.25 rating | 14,279 views | 1 Comment10 years ago -
People
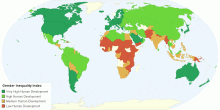
Gender Inequality Index(GII)
This chart shows the Global Inequality Index(GII) by Country. The Gender Inequality Index (GII) reflects women’s disadvantage in three dimensions—re ...4.14 rating | 172,614 views | 11 Comments10 years ago -
Country Info
Global Benchmark Complexity Rank
This chart shows Global Benchmark Complexity Rank by Country.. Benchmarking is the process of comparing one's business processes and performance metri ...5.00 rating | 6,859 views | Discuss this10 years ago -
Information and Communication Technology
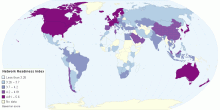
Network Readiness Index
This chart shows the Global Network Readiness Index for the year 2015 by country. The World Economic Forum's Networked Readiness Index(NRI), also referred t ...4.09 rating | 12,681 views | Discuss this10 years ago -
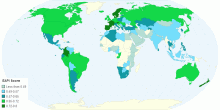
Energy
Global Energy Architecture Performance Index 2015
This chart shows the Global Energy Architecture Performance Index 2015.. The EAPI is a composite index that focuses on tracking specific indicators to measure ...5.00 rating | 4,969 views | Discuss this10 years ago -
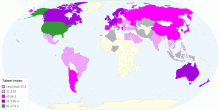
Education
Global Talent Index 2015
This chart shows the Global Talent Index 2015 by Country. A Talent is the skill that someone naturally has to do something that is hard. It is an ability that s ...4.00 rating | 8,307 views | Discuss this10 years ago -
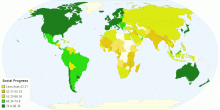
Social
Social Progress Index 2015
This chart shows the Social Progress Index 2015. The Social Progress Index measures the extent to which countries provide for the social and environmental need ...3.60 rating | 10,494 views | Discuss this10 years ago -
Energy
CERN International Relations
This chart shows the CERN International Relations... The European Organization for Nuclear Research known as CERN is a European research organization that opera ...0.00 rating | 3,872 views | Discuss this10 years ago -
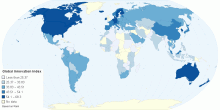
Education
Global Innovation Index(GII)
This chart shows the Global Innovation Index in 2015 by country. The Global Innovation Index (GII) aims to capture the multi-dimensional facets of innovation an ...4.60 rating | 10,805 views | Discuss this10 years ago -
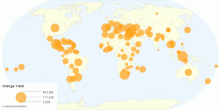
Food & Agriculture
Orange Yield by Country
This map shows the Orange Yield by Country. The orange (the sweet orange) is the fruit of the citrus species Citrus × sinensis in the family Rutaceae.The ...3.67 rating | 4,719 views | Discuss this10 years ago -
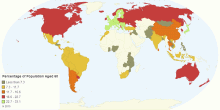
Population
Percentage of Population Aged 60
This chart shows the Percentage of Population aged 60 plus in 2015,2030 and 2050. The world population has been experiencing significant ageing that results in ...3.91 rating | 9,257 views | Discuss this10 years ago -
Economic
Financial Secrecy Index(FSI)
This chart shows the Global Financial Secrecy Index for the year 2015. The Financial Secrecy Index 2015 has reviewed 102 jurisdictions, and has ranked 92 jurisd ...3.67 rating | 6,560 views | Discuss this10 years ago -
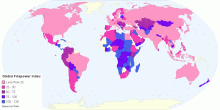
Country Info
Global Firepower Index
This chart shows the Global FirePower Index 2015. Global Firepower (GFP) continues to provide its unique analytical display of data concerning modern military p ...3.57 rating | 53,002 views | Discuss this10 years ago -
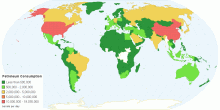
Energy
Petroleum Consumption
This chart shows the Consumption of Petroleum by Country. This shows the country's total consumption of refined petroleum products, in barrels per day (bbl/ ...4.20 rating | 9,283 views | Discuss this10 years ago -
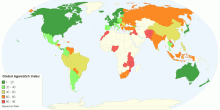
Health
Global Agewatch Index
This chart shows the Global AgeWatch Index 2015. The Global AgeWatch Index provides an analysis of results by region. It measures four key domains for older peo ...4.05 rating | 12,536 views | Discuss this10 years ago