-
Population
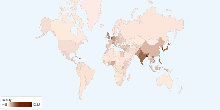
Current World Population Density
This chart shows current world population density. Current World Population Density: 13.31 people per km²4.13 rating | 32,236 views | 2 Comments16 years ago -
Population
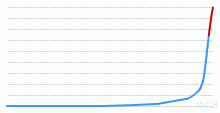
Historical Population of World, 1 AD to Future
This chart shows the historical population statistics of World - 1 AD onwards.3.83 rating | 65,917 views | 5 Comments16 years ago -
Society
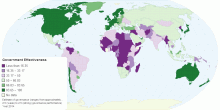
Government Effectiveness
This map shows "Government Effectiveness", a dimension of governances in Worldwide Governance Indicators (WGI) project by World Bank Group, which refle ...4.42 rating | 22,119 views | Discuss this9 years ago -
Society
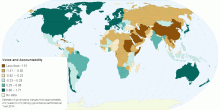
Voice and Accountability
This map shows "Voice and Accountability", a dimension of governances in Worldwide Governance Indicators (WGI) project by World Bank Group, which refle ...3.67 rating | 25,207 views | Discuss this9 years ago -
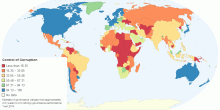
Society
Control of Corruption
This map shows "Control of Corruption", a dimension of governances in Worldwide Governance Indicators (WGI) project by World Bank Group, which reflects ...4.38 rating | 18,925 views | 1 Comment9 years ago -
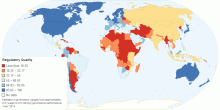
Society
Regulatory Quality
This map shows "Regulatory Quality", a dimension of governances in Worldwide Governance Indicators (WGI) project by World Bank Group, which reflects pe ...4.43 rating | 11,264 views | Discuss this9 years ago -
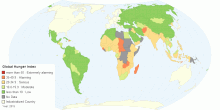
Health
Global Hunger Index
This map shows Global Hunger Index (GHI) for 128 developing countries. The Global Hunger Index (GHI) is a tool adapted and further developed by the Internationa ...3.90 rating | 88,783 views | 5 Comments9 years ago -
Population
Current World Population Growth Rate
This map shows current world population growth rate. Current World Population Growth Rate: 1.092% (2011 est.) Population growth is the change in a population o ...4.28 rating | 29,371 views | Discuss this14 years ago -
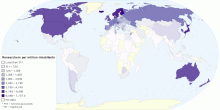
Education
Number of Researchers per million inhabitants by Country
This map shows the distribution of researchers per million inhabitants, latest available year. Researchers are professionals engaged in the conception or creatio ...4.62 rating | 241,428 views | 16 Comments14 years ago -
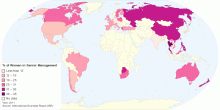
Work
Proportion of Women in Senior Management - 2011
This map shows proportion of Women in Senior Management (2011). Global average: 20% of Women in Senior Management Research from the 2011 Grant Thornton Inter ...4.76 rating | 18,846 views | 1 Comment14 years ago -
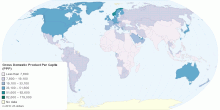
Economic
Current Worldwide Gross Domestic Product Per Capita ...
This entry shows Gross Domestic Product (GDP) on a purchasing power parity (PPP) basis divided by population as of 1 July for the same year. World Gross Domesti ...4.35 rating | 9,778 views | 1 Comment14 years ago -
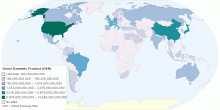
Economic
Current Worldwide Gross Domestic Product (Official ...
This map shows the gross domestic product (GDP) or value of all final goods and services produced within a nation in a given year. World GWP (gross world produc ...4.20 rating | 9,848 views | Discuss this14 years ago -
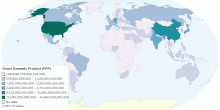
Economic
Current Worldwide Gross Domestic Product (Purchasin ...
This map shows the gross domestic product (GDP) or value of all final goods and services produced within a nation in a given year. Current World GDP (PPP): 74.5 ...4.20 rating | 9,694 views | Discuss this14 years ago -
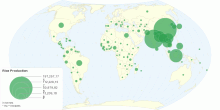
Food & Agriculture
Worldwide Rice Production
This map shows global rice production. Worldwide Rice Production : 678,688,289 tonnes Worldwide Rice Area Harvested : 161,420,743 Ha World production of rice ...4.19 rating | 62,192 views | 6 Comments14 years ago -
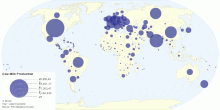
Food & Agriculture
Current Worldwide Cow Milk Production
This map shows current worldwide Cow milk (whole, fresh) production. World Total Cow Milk Production: 585,234,624 tonnes per year4.57 rating | 30,371 views | Discuss this14 years ago