-
Economic
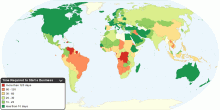
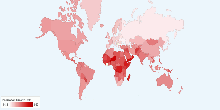
Time Required to Start a Business
This map shows time required to start a business around the world in days. Time required to start a business is the number of calendar days needed to complete th ...4.56 rating | 64,667 views | 14 Comments16 years ago -
Energy
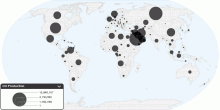
Current Worldwide Oil Production
This chart shows current oil production in the world. Current Oil Production in the World: 81,820,404.59 barrels per day (bbl/day) 1 barrel = (42 US gallons, 158 ...4.04 rating | 65,878 views | 13 Comments16 years ago -
Drugs & Crime
Current Worldwide Annual Prevalence of Cannabis amo ...
This chart shows current worldwide annual prevalence of cannabis in population aged 15-64. Number of people who used cannabis at least once in year: 142.6 - 190. ...4.28 rating | 37,782 views | 8 Comments17 years ago -
Religion
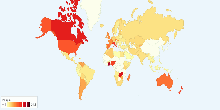
Muslim Population by Country
This map shows current Muslim population in the world. Percentage of 1990 world population that is Muslim: 19.9% (1,050,963,000 people) Percentage of 2000 world ...4.28 rating | 131,823 views | 8 Comments15 years ago -
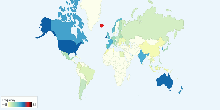
Environment
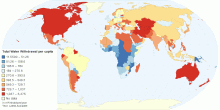
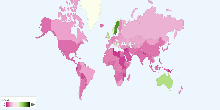
Total Water Use per capita by Country
This map shows total water withdrawal per capita by country. Water withdrawal is the quantity of water removed from available sources for use in any purpose. Wat ...3.90 rating | 397,185 views | 8 Comments15 years ago -
Population
Current World Population Growth Rate
This chart shows current world population growth rate. Current World Population Growth Rate: 1.17%3.42 rating | 48,917 views | 7 Comments17 years ago -
Drugs & Crime
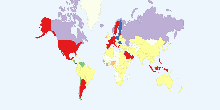
Best selling Cigarette brand in each Country
This chart shows top-selling cigarette brand in each country. Some Famous cigarette brand: Marlboro top in 30 countries Mild Seven top in 1 countri ...3.93 rating | 433,600 views | 7 Comments16 years ago -
Social
Length of Maternity Leave around the World
This chart shows length of maternity leave around the world. Note: see note - Check Dataset for more information.4.23 rating | 39,839 views | 6 Comments17 years ago -
Education
Duration of Compulsory Education around the World
This chart shows duration of compulsory education around the world. Compulsory education means number of years that children are legally obliged to attend school ...3.92 rating | 57,586 views | 6 Comments17 years ago -
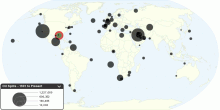
Environment
The Largest Oil Spills in History, 1901 to Present
This map shows the largest oil spills in history (1901 to Present), from tanker accidents and drilling operations, as well as a number of other notable spills. A ...4.22 rating | 234,923 views | 6 Comments16 years ago -
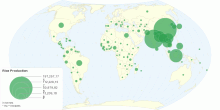
Food & Agriculture
Worldwide Rice Production
This map shows global rice production. Worldwide Rice Production : 678,688,289 tonnes Worldwide Rice Area Harvested : 161,420,743 Ha World production of rice ...4.19 rating | 65,339 views | 6 Comments15 years ago -
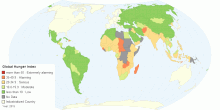
Health
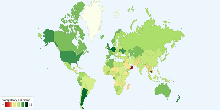
Global Hunger Index
This map shows Global Hunger Index (GHI) for 128 developing countries. The Global Hunger Index (GHI) is a tool adapted and further developed by the Internationa ...3.91 rating | 92,208 views | 5 Comments10 years ago -
Social
Number of Cinema Admissions per Person by Country, ...
This chart shows number of cinema admissions per person in each country. Number of cinema admissions in the major countries: ~1.45 visits per person3.85 rating | 29,638 views | 4 Comments17 years ago -
Environment
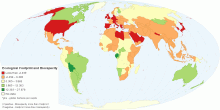
Ecological Footprint of Consumption Compared to Biocapacity
This map compares each country's total consumption Footprint with the biocapacity available within its own borders. Many countries rely, in net terms, on th ...4.14 rating | 88,296 views | 4 Comments15 years ago -
Health
Current World People Living with HIV/AIDS
This chart shows current world people living with HIV/AIDS. Current World People Living with HIV/AIDS: 33 million3.42 rating | 18,978 views | 3 Comments17 years ago