-
Environment
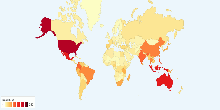
Threatened species of Animals in each Country
This chart shows threatened species of animals in each Red List category in each country. Red List includes Critically Endangered, Endangered and Vulnerable spec ...3.73 rating | 22,228 views | 3 Comments17 years ago -
Country Info
Length of Coastline by Country
This map shows length of coastline in each country. The total length of coastline in the world: 356,000 km This entry gives the total length of the boundary be ...3.86 rating | 132,698 views | 3 Comments16 years ago -
Immigration
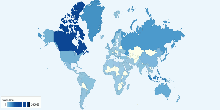
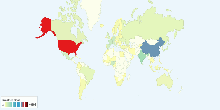
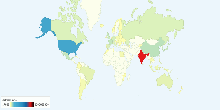
Total Refugees by Country of Asylum (Received)
This map shows total refugees (received) by country of asylum or residence. Total refugees in the world: 10,478,621 Refugees leave their country because they h ...4.35 rating | 26,075 views | 2 Comments16 years ago -
Economic
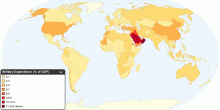
Current Worldwide Military Expenditure as a percent ...
This map shows public expenditure in a given financial year on military as a percentage of gross domestic product (GDP). Current world military expenditure: roug ...4.32 rating | 30,281 views | 2 Comments16 years ago -
Health
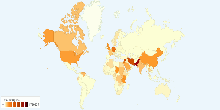
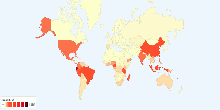
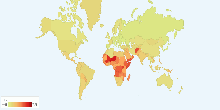
Worldwide Malaria Deaths
This map shows worldwide malaria deaths, 1990 - 2009. Worldwide malaria deaths: 117,704 (Year: 2009) Today (April 25) is World Malaria Day. What is Malaria? ...4.37 rating | 230,985 views | 2 Comments15 years ago -
Environment
Threatened Species of Plants in each Country
This chart shows threatened species of plants in each Red List category in each country. Number of threatened species of plants in 2008: 10962 Current Number o ...4.14 rating | 11,798 views | 1 Comment17 years ago -
Social
Number of Cinema Screens by Country
This chart shows number of cinema screens in each country. Cinema screens include Indoor screens and Drive-in screens. Number of cinema screens in the maj ...3.69 rating | 83,801 views | 1 Comment17 years ago -
Economic
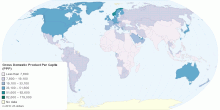
Current Worldwide Gross Domestic Product Per Capita ...
This entry shows Gross Domestic Product (GDP) on a purchasing power parity (PPP) basis divided by population as of 1 July for the same year. World Gross Domesti ...4.35 rating | 10,729 views | 1 Comment15 years ago -
Work
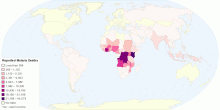
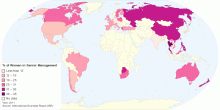
Proportion of Women in Senior Management - 2011
This map shows proportion of Women in Senior Management (2011). Global average: 20% of Women in Senior Management Research from the 2011 Grant Thornton Inter ...4.76 rating | 20,414 views | 1 Comment15 years ago -
Society
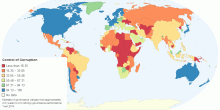
Control of Corruption
This map shows "Control of Corruption", a dimension of governances in Worldwide Governance Indicators (WGI) project by World Bank Group, which reflects ...4.38 rating | 20,146 views | 1 Comment10 years ago -
Energy
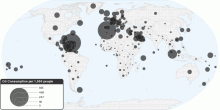
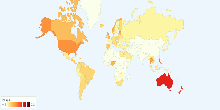
Current Worldwide Oil Consumption per 1000 people
This chart shows current oil consumption (per capita) in the world. Current Oil Consumption in the World: 31.1 barrels per day (bbl/day) per 1,000 people 1 b ...3.48 rating | 29,424 views | Discuss this16 years ago -
Health
Current World Total Fertility Rate
This chart shows current world total fertility rate. Current World Total Fertility Rate: 2.58 children born/woman over her lifetime3.46 rating | 19,836 views | Discuss this17 years ago -
Energy
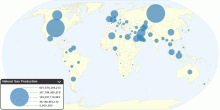
Current Worldwide Natural Gas Production
This chart shows current Natural Gas Production in the world. Current Natural Gas Production in the World: 3,065,690,558,538 cubic meters (cu m)3.86 rating | 20,152 views | Discuss this17 years ago -
Drugs & Crime
Current Worldwide Annual Prevalence of Amphetamines ...
This chart shows current worldwide annual prevalence of amphetamine-type stimulants (excluding ecstasy) in population aged 15-64. Number of people who used Amphe ...3.74 rating | 15,214 views | Discuss this17 years ago -
Social
Number of Cinema Admissions by Country, latest avai ...
This chart shows number of cinema admissions in each country. Number of cinema admissions in the major countries: ~6,870,868,430 Note: More cin ...3.62 rating | 23,822 views | Discuss this17 years ago