-
Environment
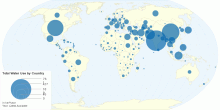
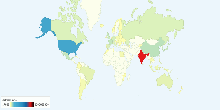
Total Water Use by Country
This map shows total water withdrawal for agricultural, industrial and municipal purposes by country. Water withdrawal is the quantity of water removed from avai ...3.97 rating | 38,312 views | Discuss this15 years ago -
Drugs & Crime
Current Worldwide Annual Prevalence of Cannabis amo ...
This chart shows current worldwide annual prevalence of cannabis in population aged 15-64. Number of people who used cannabis at least once in year: 142.6 - 190. ...4.28 rating | 37,782 views | 8 Comments17 years ago -
Population
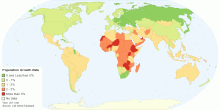
Current World Population Growth Rate
This map shows current world population growth rate. Current World Population Growth Rate: 1.092% (2011 est.) Population growth is the change in a population o ...4.29 rating | 32,047 views | Discuss this15 years ago -
Food & Agriculture
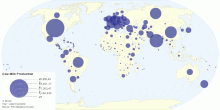
Current Worldwide Cow Milk Production
This map shows current worldwide Cow milk (whole, fresh) production. World Total Cow Milk Production: 585,234,624 tonnes per year4.59 rating | 31,574 views | Discuss this15 years ago -
Economic
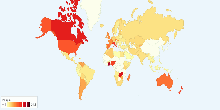
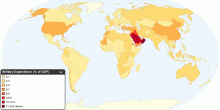
Current Worldwide Military Expenditure as a percent ...
This map shows public expenditure in a given financial year on military as a percentage of gross domestic product (GDP). Current world military expenditure: roug ...4.32 rating | 30,281 views | 2 Comments16 years ago -
Social
Number of Cinema Admissions per Person by Country, ...
This chart shows number of cinema admissions per person in each country. Number of cinema admissions in the major countries: ~1.45 visits per person3.85 rating | 29,638 views | 4 Comments17 years ago -
Energy
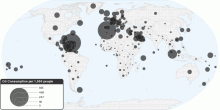
Current Worldwide Oil Consumption per 1000 people
This chart shows current oil consumption (per capita) in the world. Current Oil Consumption in the World: 31.1 barrels per day (bbl/day) per 1,000 people 1 b ...3.48 rating | 29,424 views | Discuss this16 years ago -
Society
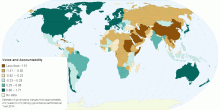
Voice and Accountability
This map shows "Voice and Accountability", a dimension of governances in Worldwide Governance Indicators (WGI) project by World Bank Group, which refle ...3.71 rating | 27,329 views | Discuss this10 years ago -
Immigration
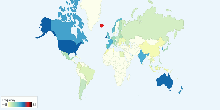
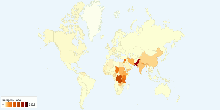
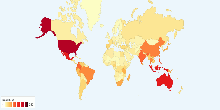
Number of Refugees per 1 USD GDP (PPP) per capita b ...
This map shows number of refugees per 1 USD GDP (PPP) per capita by country. Contrary to the widespread perception that industrialized countries are hosting the ...4.36 rating | 27,178 views | Discuss this16 years ago -
Immigration
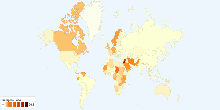
Number of Refugees per 1000 inhabitants by Country
This map shows number of refugees per 1000 inhabitants by country.4.38 rating | 26,161 views | Discuss this16 years ago -
Immigration
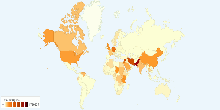
Total Refugees by Country of Asylum (Received)
This map shows total refugees (received) by country of asylum or residence. Total refugees in the world: 10,478,621 Refugees leave their country because they h ...4.35 rating | 26,075 views | 2 Comments16 years ago -
Society
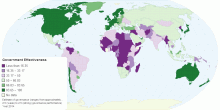
Government Effectiveness
This map shows "Government Effectiveness", a dimension of governances in Worldwide Governance Indicators (WGI) project by World Bank Group, which refle ...4.39 rating | 25,160 views | Discuss this10 years ago -
Social
Number of Cinema Admissions by Country, latest avai ...
This chart shows number of cinema admissions in each country. Number of cinema admissions in the major countries: ~6,870,868,430 Note: More cin ...3.62 rating | 23,822 views | Discuss this17 years ago -
Environment
Threatened species of Animals in each Country
This chart shows threatened species of animals in each Red List category in each country. Red List includes Critically Endangered, Endangered and Vulnerable spec ...3.73 rating | 22,228 views | 3 Comments17 years ago -
Work
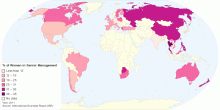
Proportion of Women in Senior Management - 2011
This map shows proportion of Women in Senior Management (2011). Global average: 20% of Women in Senior Management Research from the 2011 Grant Thornton Inter ...4.76 rating | 20,414 views | 1 Comment15 years ago