-
Food & Agriculture
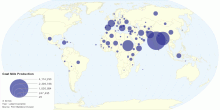
Current Worldwide Goat Milk Production
This map shows current worldwide Goat Milk (whole, fresh) production. World Total Goat Milk Production: 15,510,411 tonnes per year4.63 rating | 28,006 views | Discuss this14 years ago -
Food & Agriculture
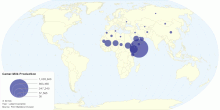
Current Worldwide Camel Milk Production
This map shows current worldwide Camel milk (whole, fresh) production. World Total Camel Milk Production: 1,840,201 tonnes per year4.50 rating | 16,940 views | 1 Comment14 years ago -
Food & Agriculture
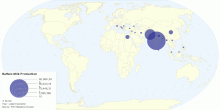
Current Worldwide Buffalo Milk Production
This map shows current worldwide Buffalo Milk (whole, fresh) production. World Total Buffalo Milk production: 92,140,146 tonnes per year4.20 rating | 22,747 views | 1 Comment14 years ago -
Environment
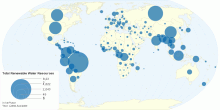
Total Renewable Water Resources per capita by Country
This map shows total renewable water resources per capita by country. Current world total renewable water resources: ~24,776 m³ (cu m)/inhabitant/year ( 24 ...4.36 rating | 96,731 views | Discuss this14 years ago -
Environment
Total Renewable Water Resources by Country
This map shows total renewable water resources by country. It corresponds to the maximum theoretical yearly amount of water actually available for a country at a ...4.29 rating | 34,672 views | 4 Comments14 years ago -
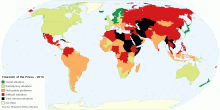
Social
World Press Freedom Index
This chart shows Press Freedom Index, which ranks 178 countries around the world according to press freedom violations. What is Press Freedom Index? The Press ...4.35 rating | 105,239 views | 6 Comments14 years ago -
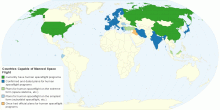
Others
Countries Capable of Manned Space Flight
This map shows countries capable of manned space flight. Manned spaceflight is spaceflight with a human crew and possibly passengers. This makes it unlike robot ...4.41 rating | 17,730 views | 2 Comments14 years ago -
Economic
Global Software Piracy
This maps shows global software piracy. World Software Commercial Value of Unlicensed Software: US $51.4 billion in 2009 ($53 billion in 2008) World Software P ...4.38 rating | 24,651 views | Discuss this14 years ago -
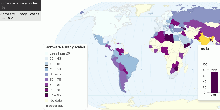
Education
Percentage of Female Researchers within the Total R ...
This map shows percentage of female researchers as a share of the worldwide total researchers. Researchers are defined as professionals engaged in the conception ...4.53 rating | 15,434 views | 1 Comment14 years ago -
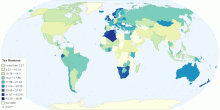
Economic
Total Tax Revenue as a Percentage of Gross Domestic ...
This map shows total tax revenue as a percentage of Gross Domestic Product (GDP). Current world average tax revenue: 15.97% of world GDP Tax revenue refers to ...4.56 rating | 33,426 views | 1 Comment14 years ago -
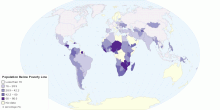
Economic
Percentage of Population Living in Poverty
This map shows national estimates of the percentage of the population falling below the poverty line. Definitions of poverty vary considerably among nations. For ...3.71 rating | 57,082 views | 3 Comments14 years ago -
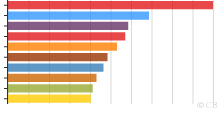
Social
Top 10 Most Pirated Movies of 2010
This graph shows top 10 most pirated movies of 2010. With 16,580,000 downloads on BitTorrent alone, Avatar is undisputedly the most pirated film of the year 201 ...4.26 rating | 24,777 views | 1 Comment14 years ago -
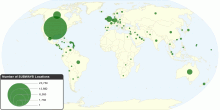
Country Info
Number of SUBWAY® Restaurant Locations in the World
This map shows number of SUBWAY restaurant locations in each country. Number of SUBWAY Restaurants (or Franchise) in the world: 33,679 in 93 countries and terri ...3.75 rating | 127,167 views | 2 Comments14 years ago -
Food & Agriculture
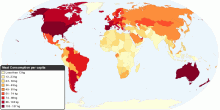
Current Worldwide Annual Meat Consumption per capita
This map shows current worldwide annual Meat Consumption per capita. World average meat consumption: 46.6 kg per person per year4.69 rating | 178,969 views | 25 Comments15 years ago -
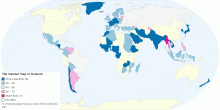
Country Info
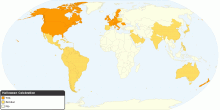
Halloween Celebration Around the World
This chart shows halloween celebration around the world. **** Happy Halloween! **** What is Halloween? Holiday observed on October 31, the eve of All Saints' ...3.59 rating | 51,703 views | 16 Comments15 years ago