-
Country Info
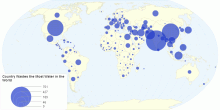
Country Wastes the Most Water in the World
This map shows total water withdrawal for agricultural, industrial and municipal purposes by country. Water withdrawal is the quantity of water removed from avai ...2.77 rating | 4,599 views | Discuss this11 years ago -
Food & Agriculture
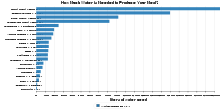
How Much Water is Needed to Produce Your Meal?
UN-Water World Water Day 2012: Water and Food Security4.62 rating | 8,595 views | 2 Comments14 years ago -
Environment
Water Usage Per Person Per Day in Liter
A map, showing waterusage per person, per day in liter.4.33 rating | 22,952 views | 6 Comments12 years ago -
Country Info
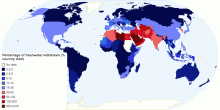
Percentage of freshwater withdrawn
Proportion of total actual renewable freshwater resources withdrawn as a % of country reserve Aquastat - MDG Water Indicator (around 2006) - most up-to-date dat ...5.00 rating | 3,110 views | Discuss this12 years ago -
Environment
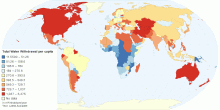
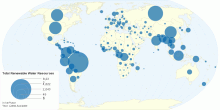
Total Water Use per capita by Country
This map shows total water withdrawal per capita by country. Water withdrawal is the quantity of water removed from available sources for use in any purpose. Wat ...3.90 rating | 389,997 views | 8 Comments14 years ago -
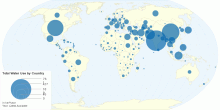
Environment
Total Water Use by Country
This map shows total water withdrawal for agricultural, industrial and municipal purposes by country. Water withdrawal is the quantity of water removed from avai ...3.97 rating | 36,676 views | Discuss this14 years ago -
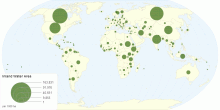
Environment
Inland Water Area by Country
This chart shows inland water area details by country. Inland waters are permanent water bodies inland from the coastal zone and areas whose properties and use ...4.27 rating | 9,480 views | Discuss this10 years ago -
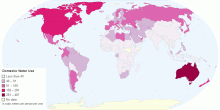
Food & Agriculture
Domestic Water Use by Country
This chart shows Domestic Water Use by Country. Domestic water use is water used for indoor and outdoor household purposes— all the things you do at home ...3.81 rating | 18,964 views | Discuss this8 years ago -
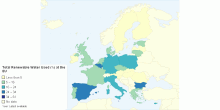
Environment
Total Renewable Water Used at the EU
This percentage indicates the total freshwater withdrawn by a country relating to the actual total renewable water resources. The total renewable water resources ...4.11 rating | 7,377 views | Discuss this13 years ago -
Environment
Surface Area of the Earth
This chart shows total surface area of earth. Total surface area of earth: 510,072,000 sq km Total water surface area: 70.8% (361,132,000 sq km) Tot ...4.44 rating | 366,317 views | 19 Comments15 years ago -
Environment
Total Renewable Water Resources by Country
This map shows total renewable water resources by country. It corresponds to the maximum theoretical yearly amount of water actually available for a country at a ...4.29 rating | 34,673 views | 4 Comments14 years ago -
Environment
Total Renewable Water Resources per capita by Country
This map shows total renewable water resources per capita by country. Current world total renewable water resources: ~24,776 m³ (cu m)/inhabitant/year ( 24 ...4.36 rating | 96,751 views | Discuss this14 years ago -
Health
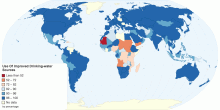
Population Using Improved Drinking-water Sources by Country
This map shows Population Using Improved Drinking-water Sources by Country. Drinking water is water safe enough to be consumed by humans or used with low r ...3.22 rating | 11,508 views | Discuss this10 years ago -
Environment
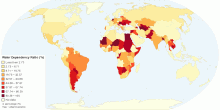
Total Renewable Water Resources Dependency Ratio by Country
This map shows the percent of total renewable water resources dependency ratio or originating outside the country. What is Dependency ratio? Dependency ratio m ...4.81 rating | 32,680 views | 2 Comments14 years ago -
Country Info
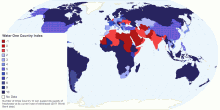
Water: One Country Index
World Bank data (2011) Reserve: Renewable internal freshwater resources (billion cubic meters) World Bank Withdrawal: Annual Freshwater Withdra ...3.29 rating | 4,783 views | Discuss this12 years ago