-
Health
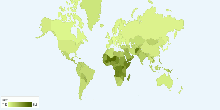
Current World Birth Rate
This chart shows current world birth rate. Current World Birth Rate: 19.95 births/1,000 people This entry gives the average annual number of births during a ye ...3.59 rating | 46,738 views | 5 Comments17 years ago -
Health
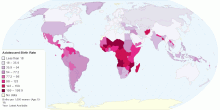
Adolescent Birth Rate
This map shows adolescent birth rate, that measures the annual number of births to women 15 to 19 years of age per 1,000 women in that age group. It represents t ...4.55 rating | 34,974 views | 3 Comments14 years ago -
People
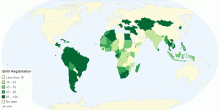
Birth Registration By Country
This chart shows birth registration details by country. Birth registration is the process by which a childʼs birth is record- ed in the civil register by the g ...4.20 rating | 5,600 views | Discuss this11 years ago -
Population
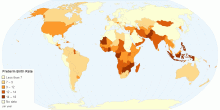
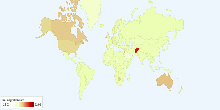
Preterm Birth Rate by Country
This chart shows preterm birth rate by country. Preterm birth, also known as premature birth, is the birth of a baby at less than 37 weeks gestational age.These ...4.02 rating | 15,284 views | Discuss this11 years ago -
People
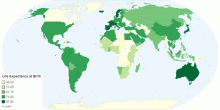
Life Expectancy at Birth in Years
This map shows life expectancy at birth in years by country Life expectancy is a statistical measure of how long a person or organism may live, based on the yea ...4.11 rating | 7,558 views | Discuss this11 years ago -
Health
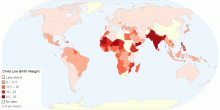
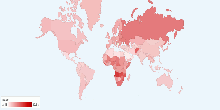
Child Low Birth Weight by Country
This map shows child low birth weight by country. Low birth weight (LBW) is defined as a birth weight of a liveborn infant of less than 2,500 g (5 pounds 8 ounc ...4.69 rating | 7,827 views | Discuss this11 years ago -
Health
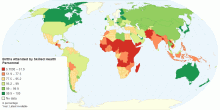
Percentage of Births Attended by Skilled Health Personnel
This map shows percentage of deliveries attended by health personnel(doctors, nurses or midwives) trained in providing life saving obstetric care, including givi ...4.31 rating | 18,553 views | 4 Comments15 years ago -
Health
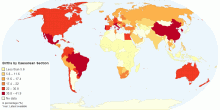
Percentage of Births by Caesarean Section
This map shows percentage of births by caesarean section among all live births in a given time period.4.63 rating | 38,105 views | Discuss this15 years ago -
People
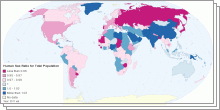
World Sex Ratio 2011
This collection of interactive maps shows Sex Ratio in five age groups - at birth, under 15 years, 15-64 years, 65 years and over, and for the total population. ...4.01 rating | 218,070 views | 3 Comments15 years ago -
Economic
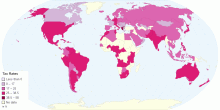
Tax Rates by Country
This chart shows Tax Rates by Country. This is a list of tax rates around the world. It focuses on Two types of tax: & ...4.38 rating | 10,955 views | Discuss this9 years ago -
Immigration
Migration Rate by Country
This chart shows migration rate by country (migrant(s)/1,000 population).4.24 rating | 18,407 views | Discuss this17 years ago -
Health
Current World Death Rate
This chart shows current world death rate. Current World Death Rate: 8.23 deaths/1,000 people4.05 rating | 18,929 views | 1 Comment17 years ago -
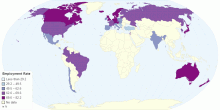
Economic
Employment Rate by Country
This chart shows Employment Rate by Country Employment is a relationship between two parties, usually based on a contract where work is paid for, where on ...4.11 rating | 39,495 views | Discuss this9 years ago -
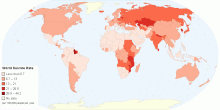
People
World Suicide Rate
This chart shows World Suicide Rate (per 100,000 people per year). Suicide is the act of intentionally causing one's own death.Risk factors include mental i ...4.27 rating | 14,548 views | Discuss this10 years ago -
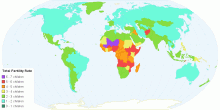
Population
Total Fertility Rate in 2015
This chart shows the Total Fertility Rate in 2015 by country. Total fertility rate (TFR) compares figures for the average number of children that would be born ...3.40 rating | 13,215 views | Discuss this10 years ago