Current Worldwide Annual Prevalence of Cocaine among Adults
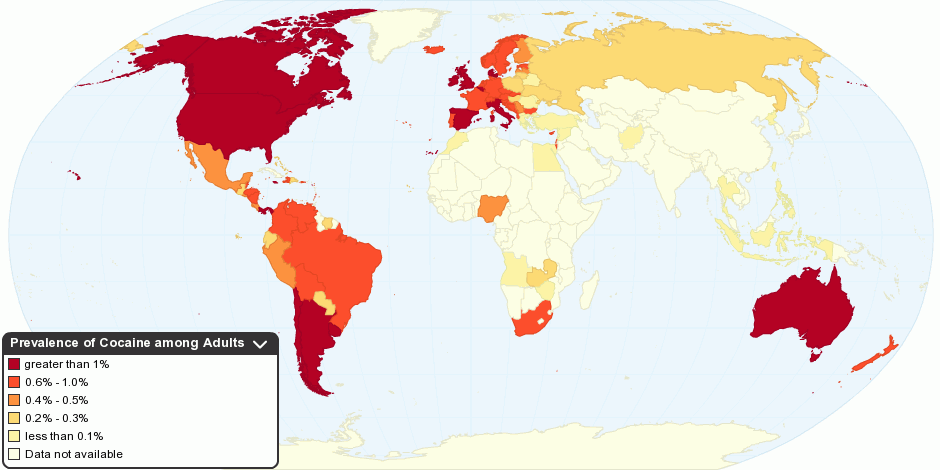
This chart shows current worldwide annual prevalence of cocaine in population aged 15-64.
Number of people who used cocaine at least once in year: 15 - 19.3 million people (equivalent to 0.3% to 0.4% of the population) worldwide
Cocaine has been a popular recreational drug for decades, and while demand appears to be on the wane in its largest markets, it has gained popularity in an ever widening range of countries. 'Cocaine' comprises at least two distinct drug products: powder cocaine on the one hand, and a range of cocaine base products, mostly falling under the heading of 'crack', on the other. Powder cocaine produces a more subtle effect, is more expensive to use, and has become emblematic of economic success in some circles. Demand has emerged in many developing countries, particularly among elites. Crack is cheaper, more intense, and associated with prostitution and street crime. Traditionally, crack use was rare outside the United States of America and the United Kingdom, but this also appears to be changing, especially in Latin America and parts of Africa.
According to United Nations Office on Drugs and Crime (UNODC) the new estimates – like those reported for previous years - suggest that the largest market is still North America, followed by West and Central Europe and South America. Compared to previous year, the range shifted to lower levels, suggesting a decrease in the global number of cocaine users. This change is due to the decrease in the number of cocaine users in North America. In addition, missing data and/or absence of recent reliable estimates affect many regions, particularly East Africa, Central Asia, the Near and Middle East and South Asia.
For more information please follow the reference link below.
2 months ago
| Country name | Annual prevalence (%) | Year | Source |
| Afghanistan | less than 0.1 | 2009 | UNODC/ Govt. Source |
| Albania | 0.8 | 2006 | ESPAD |
| Angola | 0.1 | 1999 | UNODC Estimate |
| Antigua and Barbuda | 0.9 | 2005 | Government source |
| Argentina | 2.6 | 2006 | UNODC/ CICAD |
| Armenia | 0.1 | 2005 | UNODC Estimate |
| Australia | 1.9 | 2007 | Government source |
| Austria | 0.9 | 2008 | Govt. |
| Bahamas, The | 0.2 | 2008 | ARQ |
| Barbados | 0.4 | 2006 | CICAD |
| Belarus | less than 0.1 | 2007 | ESPAD |
| Belgium | 1.2 | 2007 | ESPAD |
| Belize | 0.9 | 2005 | CICAD |
| Bolivia | 0.8 | 2007 | UNODC/ CICAD |
| Bosnia and Herzegovina | 0.6 | 2008 | ESPAD |
| Brazil | 0.7 | 2005 | Government source |
| Bulgaria | 0.6 | 2007 | ARQ |
| Canada | 1.9 | 2008 | ARQ |
| Cape Verde | 0.2 | 2004 | UNODC Estimate |
| Cayman Islands | 0.6 | 2000 | UNODC Estimate |
| Chile | 2.4 | 2008 | ARQ |
| Colombia | 0.8 | 2008 | Government source |
| Costa Rica | 0.4 | 2006 | ARQ |
| Croatia | 0.9 | 2007 | ESPAD |
| Cyprus | 0.6 | 2006 | |
| Czech Republic | 0.7 | 2008 | Government sources |
| Denmark | 1.4 | 2008 | ARQ |
| Dominican Republic | 0.3 | 2008 | ARQ |
| Ecuador | 0.3 | 2007 | UNODC/ CICAD |
| Egypt | less than 0.1 | 2006 | Govt; Academic Research |
| El Salvador | 0.4 | 2005 | CICAD |
| Estonia | 0.6 | 2008 | Government sources |
| Finland | 0.5 | 2006 | ARQ |
| France | 0.6 | 2005 | ARQ |
| Germany | 0.7 | 2006 | Government source |
| Greece | 0.1 | 2004 | ARQ |
| Grenada | 0.9 | 2005 | CICAD |
| Guatemala | 0.2 | 2005 | ARQ |
| Haiti | 0.9 | 2005 | UNODC Estimate |
| Honduras | 0.9 | 2005 | ARQ |
| Hong Kong | 0.3 | 2008 | Government source |
| Hungary | 0.2 | 2007 | ARQ |
| Iceland | 0.9 | 2007 | ESPAD |
| Indonesia | less than 0.1 | 2008 | ARQ |
| Ireland | 1.7 | 2007 | Government source |
| Israel | 0.6 | 2008 | Government source |
| Italy | 2.2 | 2008 | Government source |
| Jamaica | 1.1 | 2006 | UNODC Estimate |
| Korea, North | less than 0.1 | 2004 | ARQ |
| Kuwait | less than 0.1 | 2005 | UNODC Estimate |
| Latvia | 0.5 | 2007 | ARQ |
| Lebanon | 0.1 | 2001 | UNODC Estimate |
| Liechtenstein | 0.8 | 2005 | UNODC Estimate |
| Lithuania | 0.2 | 2008 | ARQ |
| Luxembourg | 0.9 | 2003 | UNODC Estimate |
| Macedonia [FYROM] | less than 0.1 | 2007 | INCSR |
| Malta | 1.1 | 2007 | ESPAD |
| Mexico | 0.4 | 2008 | Govt. source (ENA) |
| Moldova | less than 0.1 | 2008 | Government sources |
| Monaco | 1.9 | 2007 | ESPAD |
| Montenegro | 0.8 | 2008 | ESPAD |
| Morocco | less than 0.1 | 2004 | ARQ |
| Netherlands | 0.6 | 2005 | ARQ |
| New Zealand | 0.6 | 2008 | Government source |
| Nicaragua | 0.7 | 2006 | CICAD |
| Nigeria | 0.5 | 1999 | UNODC Estimate |
| Norway | 0.8 | 2004 | ARQ |
| Panama | 1.2 | 2003 | Government source |
| Paraguay | 0.3 | 2003 | CICAD |
| Peru | 0.5 | 2006 | ARQ |
| Philippines | less than 0.1 | 2005 | UNODC Estimate |
| Poland | 0.2 | 2006 | ARQ |
| Portugal | 0.6 | 2007 | ARQ |
| Puerto Rico | 0.8 | 2005 | Government source |
| Romania | less than 0.1 | 2007 | ARQ |
| Russia | 0.2 | 2007 | ESPAD |
| Saint Kitts and Nevis | 1.7 | 2006 | Government source |
| Saint Lucia | 1 | 2002 | UNODC Estimate |
| Saint Vincent and the Grenadines | 0.7 | 2002 | UNODC Estimate |
| Serbia | 0.5 | 2008 | Government sources |
| Slovakia | 0.6 | 2006 | ARQ |
| Slovenia | 0.9 | 2007 | ESPAD |
| South Africa | 0.8 | 2008 | ARQ |
| Spain | 3 | 2007 | Government source |
| Suriname | 0.3 | 2007 | Government source |
| Sweden | 0.6 | 2007 | ESPAD |
| Switzerland | 0.8 | 2007 | ESPAD |
| Syria | less than 0.1 | 2005 | UNODC Estimate |
| Taiwan | 0.1 | 2005 | AMCEWG |
| Thailand | less than 0.1 | 2007 | ARQ |
| Turkey | less than 0.1 | 2003 | UNODC Estimate |
| Turks and Caicos Islands | 0.7 | 2002 | UNODC Estimate |
| Ukraine | 0.2 | 2007 | ESPAD |
| United Kingdom | 2.9 | No recent, reliable estimate located | |
| United Kingdom (England and Wales) | 3 | 2009 | Government source |
| United Kingdom (Northern Ireland) | 1.9 | 2007 | Government source |
| United Kingdom (Scotland) | 3.9 | 2009 | Government source |
| United States | 2.6 | 2008 | Govt. source (SAMSHA) |
| Uruguay | 1.4 | 2006 | UNODC/ CICAD |
| Venezuela | 0.6 | 2005 | Government source |
| Zambia | 0.2 | 2000 | UNODC Estimate |
| Zimbabwe | 0.1 | 2000 | UNODC Estimate |
| No Results | |||
| Filter : | Loading... |
Download
Static chart:
Interactive chart: Comming soon
ChartsBin statistics collector team 2010, Current Worldwide Annual Prevalence of Cocaine among Adults, ChartsBin, viewed 3rd September, 2010, <http://chartsbin.com/view/fvl>.
Source
- UNODC 2009, World Drug Report 2009, ISBN: 978-92-1-148240-9, United Nations Office on Drugs and Crime (UNODC), Vienna, viewed 23rd October, 2009, <http://www.unodc.org/unodc/en/publications.html>.
- UNODC 2010, World Drug Report 2010, ISBN: 978-92-1-148256-0, United Nations Office on Drugs and Crime (UNODC), Vienna, viewed 30th June, 2010, <http://www.unodc.org/unodc/en/publications.html>.
- View all comments (2)
- Add new comment