-
Economic
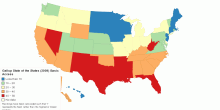
Gallup State of the States (2009) Basic Access
This map shows Gallup State of the States (2009) Basic Access rank.1.00 rating | 5,946 views | Discuss this15 years ago -
Economic
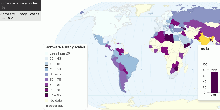
Global Software Piracy
This maps shows global software piracy. World Software Commercial Value of Unlicensed Software: US $51.4 billion in 2009 ($53 billion in 2008) World Software P ...4.38 rating | 25,396 views | Discuss this15 years ago -
Economic
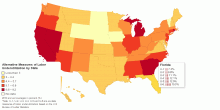
Alternative Measures of Labor Underutilization for ...
This map shows six alternative measures of labor underutilization for United States by state. United States, 2010 annual averages (percent): U-1: 5.7% U-2: ...3.67 rating | 7,258 views | Discuss this15 years ago -
Economic
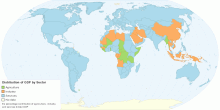
Current Worldwide Distribution of GDP by Economic Sector
This map shows worldwide distribution of gross domestic product (GDP) by economic sector. Current World Distribution of GDP by Sector: Agriculture: 5.8%; I ...4.41 rating | 111,375 views | Discuss this15 years ago -
Economic
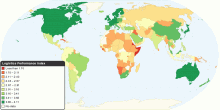
Logistics Performance Index
This map shows 2010 Logistics Performance Index (LPI). The LPI is a benchmarking tool created to help countries identify the challenges and opportunities they fa ...4.72 rating | 29,011 views | Discuss this16 years ago -
Economic
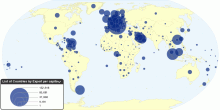
List of Countries by Exports per capita
This map shows list of countries by exports per capita. Exports means goods manufactured domestically that are bought by foreigners and sent to another county. T ...2.96 rating | 27,483 views | Discuss this16 years ago -
Economic
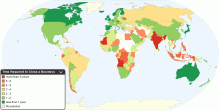
Time Required to Close a Business
This map shows time required to close a business around the world in days. This data identifies weaknesses in existing bankruptcy law and the main procedural an ...5.00 rating | 14,439 views | Discuss this16 years ago -
Economic
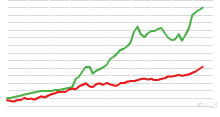
World Bicycle and Automobile Production, 1950 to Present
This chart shows World Bicycle and Automobile Production, 1950 to 2007. Note: Bicycle data include electric bicycles. 2003 bicycle data considered underestimate ...4.76 rating | 54,256 views | Discuss this16 years ago